Image:Temp-sunspot-co2.svg
From Wikipedia, the free encyclopedia
Temp-sunspot-co2.svg (SVG file, nominally 600 × 480 pixels, file size: 48 KB)
Summary
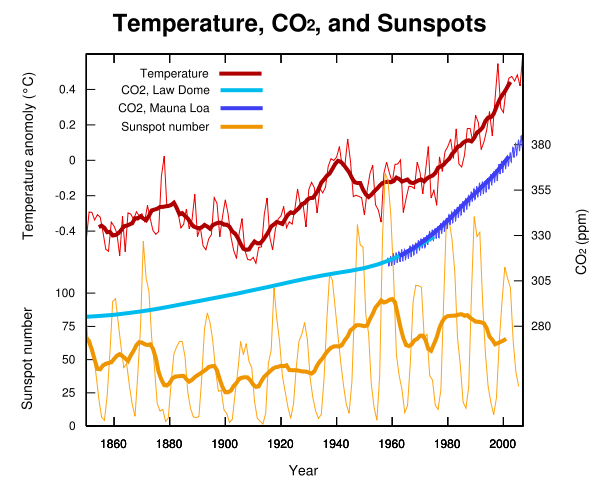
Global average temperature, atmospheric CO2, and sunspot activity since 1850.
Licensing
This figure was produced by Leland McInnes using gnuplot and Inkscape and is licensed under the GFDL. All data is from publicly available sources.
| |
I, the creator of this work, hereby grant the permission to copy, distribute and/or modify this document under the terms of the GNU Free Documentation License, Version 1.2 or any later version published by the Free Software Foundation; with no Invariant Sections, no Front-Cover Texts, and no Back-Cover Texts. Subject to disclaimers. |
Data Sources
- (light blue) Law Dome CO2 Data: ftp://ftp.ncdc.noaa.gov/pub/data/paleo/icecore/antarctica/law/law_co2.txt
- (blue) Mauna Loa CO2 data: http://www.esrl.noaa.gov/gmd/ccgg/trends/co2_mm_mlo.dat
- (red) Temperature Data: http://www.cru.uea.ac.uk/cru/data/temperature/hadcrut3gl.txt
- (orange) Sunspot data: http://sidc.oma.be/DATA/yearssn.dat
Related Images
 |
 |
 |
 |
 |
File history
Click on a date/time to view the file as it appeared at that time.
| Date/Time | Dimensions | User | Comment | |
|---|---|---|---|---|
| current | 02:47, 11 March 2007 | 600×480 (48 KB) | Leland McInnes ( Talk | contribs) | (Fix for wrong data selection) |
| revert | 02:10, 11 March 2007 | 600×480 (48 KB) | Leland McInnes ( Talk | contribs) | (Update to HadCRUT3 instead of CRUTEM) |
| revert | 20:46, 10 March 2007 | 600×480 (47 KB) | Leland McInnes ( Talk | contribs) | |
| revert | 20:41, 10 March 2007 | 600×480 (47 KB) | Leland McInnes ( Talk | contribs) | |
| revert | 05:01, 10 March 2007 | 600×480 (33 KB) | Leland McInnes ( Talk | contribs) | (Global average temperature, Mauna Loa CO<sub>2</sub>, and sunspot activity for the last 50 years.) |
See the setup instructions for more information.
File links
The following pages on Schools Wikipedia link to this image (list may be incomplete):
Categories: Self-published work