Walsall (UK Parliament constituency)
| Walsall | |
|---|---|
|
Former Borough constituency for the House of Commons | |
| 1832–1955 | |
| Number of members | one |
| Created from | Walsall North and Walsall South |
Walsall was a borough constituency centred on the town of Walsall in the West Midlands of England. It returned one Member of Parliament (MP) to the House of Commons of the Parliament of the United Kingdom, elected by the first past the post voting system.
History
In 1955 it was abolished and replaced by Walsall North and Walsall South constituencies.
Boundaries
Throughout its existence, the seat included the entirety of the County Borough of Walsall. In 1955, it was split into Walsall North and Walsall South[1]
Members of Parliament
| Election | Member | Party | |
|---|---|---|---|
| 1832 | Charles Smith Forster | Conservative | |
| 1837 | Francis Finch | Liberal | |
| February 1841 | John Neilson Gladstone | Conservative | |
| June 1841 | Robert Scott | Liberal | |
| 1847 | Edward Richard Littleton | Liberal | |
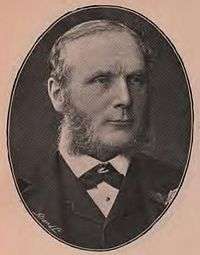
| 1852 | Sir Charles Forster | Liberal | |
| 1891 by-election | Edward Thomas Holden | Liberal | |
| 1892 | Frank James | Conservative | |
| 1893 by-election | Sir Arthur Divett Hayter | Liberal | |
| 1895 | Sydney Gedge | Conservative | |
| 1900 | Sir Arthur Divett Hayter | Liberal | |
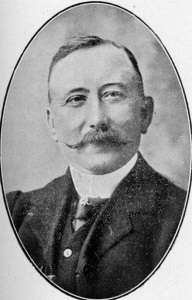
| 1906 | Edward Marten Dunne | Liberal | |
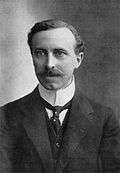
| January 1910 | Sir Richard Ashmole Cooper | Conservative | |
| 1922 | Patrick Collins | Liberal | |
| 1924 | William Preston | Conservative | |
| 1925 by-election | |||
| 1929 | John James McShane | Labour | |
| 1931 | Joseph Leckie | Liberal (Later Liberal National) | |
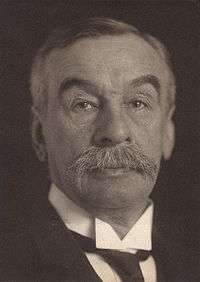
| 1938 by-election | Sir George Ernest Schuster | Liberal National | |
| 1945 | William Thomas Wells | Labour | |
| 1955 | constituency abolished: see Walsall North and Walsall South | ||
Elections
Elections in the 1880s
| Party | Candidate | Votes | % | ± | |
|---|---|---|---|---|---|
| Liberal | Charles Forster | 5,112 | 59.8 | ||
| Conservative | Frank James | 3,435 | 40.2 | ||
| Majority | 1,677 | 19.6 | |||
| Turnout | 79.6 | ||||
| Liberal hold | Swing | ||||
| Party | Candidate | Votes | % | ± | |
|---|---|---|---|---|---|
| Liberal | Charles Forster | unopposed | n/a | n/a | |
| Liberal hold | Swing | n/a | |||
Elections in the 1890s
| Party | Candidate | Votes | % | ± | |
|---|---|---|---|---|---|
| Liberal | Edward Holden | 4,899 | 52.9 | n/a | |
| Conservative | Frank James | 4,360 | 47.1 | n/a | |
| Majority | 539 | 5.8 | n/a | ||
| Turnout | 79.1 | n/a | |||
| Liberal hold | Swing | n/a | |||
| Party | Candidate | Votes | % | ± | |
|---|---|---|---|---|---|
| Conservative | Frank James | 5,226 | 51.2 | +4.1 | |
| Liberal | Edward Holden | 4,989 | 48.8 | -4.1 | |
| Majority | 237 | 2.4 | 8.2 | ||
| Turnout | 85.7 | ||||
| Conservative gain from Liberal | Swing | +4.1 | |||
| Party | Candidate | Votes | % | ± | |
|---|---|---|---|---|---|
| Liberal | Arthur Hayter | 5,235 | 50.4 | ||
| Conservative | Charles Ritchie | 5,156 | 49.6 | ||
| Majority | 79 | 0.8 | |||
| Turnout | 87.8 | ||||
| Liberal gain from Conservative | Swing | ||||
| Party | Candidate | Votes | % | ± | |
|---|---|---|---|---|---|
| Conservative | Sydney Gedge | 5,145 | 51.6 | +2.0 | |
| Liberal | Arthur Hayter | 4,828 | 48.4 | -2.0 | |
| Majority | 317 | 3.2 | 4.0 | ||
| Turnout | 90.5 | 2.7 | |||
| Conservative gain from Liberal | Swing | +2.0 | |||
Elections in the 1900s

| Party | Candidate | Votes | % | ± | |
|---|---|---|---|---|---|
| Liberal | Arthur Hayter | 5,610 | 51.5 | ||
| Conservative | Sydney Gedge | 5,285 | 48.5 | ||
| Majority | 325 | 3.0 | |||
| Turnout | 84.8 | ||||
| Liberal hold | Swing | ||||
| Party | Candidate | Votes | % | ± | |
|---|---|---|---|---|---|
| Liberal | Edward Dunne | 7,092 | 54.6 | +3.1 | |
| Conservative | Bernall Bagshawe | 5,893 | 45.4 | -3.1 | |
| Majority | 1,199 | 9.2 | +6.2 | ||
| Turnout | 91.9 | +7.1 | |||
| Liberal hold | Swing | +3.1 | |||
Elections in the 1910s
| Party | Candidate | Votes | % | ± | |
|---|---|---|---|---|---|
| Conservative | Richard Cooper | 7,290 | 51.9 | ||
| Liberal | Edward Dunne | 6,745 | 48.1 | ||
| Majority | 545 | 3.8 | |||
| Turnout | 95.4 | ||||
| Conservative gain from Liberal | Swing | ||||
| Party | Candidate | Votes | % | ± | |
|---|---|---|---|---|---|
| Conservative | Richard Cooper | 7,174 | 52.9 | +1.0 | |
| Liberal | John Morgan | 6,385 | 47.1 | -1.0 | |
| Majority | 789 | 5.8 | +2.0 | ||
| Turnout | 92.2 | -3.2 | |||
| Conservative hold | Swing | +1.0 | |||
General Election 1914/15: Another General Election was required to take place before the end of 1915. The political parties had been making preparations for an election to take place and by the July 1914, the following candidates had been selected;
- Unionist: Richard Cooper
- Liberal: William Henry Brown[12]
| Party | Candidate | Votes | % | ± | |
|---|---|---|---|---|---|
| National Party | Richard Cooper | 14,491 | 52.3 | ||
| Labour | Joseph Thickett | 8,336 | 30.0 | n/a | |
| Liberal | William Henry Brown | 4,914 | 17.7 | ||
| Majority | 6,155 | 22.3 | |||
| Turnout | 64.7 | ||||
| National Party gain from Unionist | Swing | ||||
- Cooper founded the National Party and had the support of the local Unionist Association. However, his candidature was not supported by Unionist party HQ or the Coalition Government.
Elections in the 1920s
| Party | Candidate | Votes | % | ± | |
|---|---|---|---|---|---|
| Liberal | Pat Collins | 14,674 | 38.6 | +20.9 | |
| Unionist | Alice Cooper | 14,349 | 37.8 | -14.5 | |
| Labour | Robert Dennison | 8,946 | 23.6 | -6.4 | |
| Majority | 325 | 0.8 | 35.4 | ||
| Turnout | |||||
| Liberal gain from Unionist | Swing | +17.7 | |||
| Party | Candidate | Votes | % | ± | |
|---|---|---|---|---|---|
| Liberal | Pat Collins | 16,304 | 43.5 | -4.9 | |
| Unionist | Sydney Kersland Lewis | 14,141 | 37.8 | -0.0 | |
| Labour | Arthur Carr Osburn | 7,007 | 18.7 | -4.9 | |
| Majority | 2,163 | 5.7 | +4.9 | ||
| Turnout | 82.6 | ||||
| Liberal hold | Swing | -2.4 | |||
| Party | Candidate | Votes | % | ± | |
|---|---|---|---|---|---|
| Unionist | William Preston | 15,168 | 37.9 | +0.1 | |
| Liberal | Pat Collins | 12,734 | 31.8 | -11.7 | |
| Labour | Lothian Small | 11,474 | 28.7 | +10.0 | |
| Independent | J J Lynch | 622 | 1.6 | n/a | |
| Majority | 6.1 | ||||
| Turnout | |||||
| Unionist gain from Liberal | Swing | ||||
| Party | Candidate | Votes | % | ± | |
|---|---|---|---|---|---|
| Unionist | William Preston | 14,793 | 38.2 | +0.3 | |
| Liberal | Thomas Macnamara | 12,300 | 31.8 | +0.0 | |
| Labour | Lothian Small | 11,610 | 30.0 | +1.3 | |
| Majority | 2,493 | 6.4 | +0.3 | ||
| Turnout | 83.4 | ||||
| Unionist hold | Swing | +0.1 | |||
| Party | Candidate | Votes | % | ± | |
|---|---|---|---|---|---|
| Labour | John McShane | 20,524 | 39.6 | +9.6 | |
| Unionist | William Preston | 15,818 | 30.6 | -7.6 | |
| Liberal | Thomas Macnamara | 15,425 | 29.8 | -2.0 | |
| Majority | 4,706 | 9.0 | |||
| Turnout | 85.9 | ||||
| Labour gain from Unionist | Swing | +8.6 | |||
Elections in the 1930s
| Party | Candidate | Votes | % | ± | |
|---|---|---|---|---|---|
| Liberal | Joseph Leckie | 30,507 | 56.0 | +26.2 | |
| Labour | John McShane | 23,952 | 44.0 | +4.4 | |
| Majority | 6,555 | 12.0 | |||
| Turnout | 86.3 | ||||
| Liberal hold | Swing | +10.9 | |||
- Conservative candidate, William J Talbot, withdrew.
| Party | Candidate | Votes | % | ± | |
|---|---|---|---|---|---|
| Liberal National | Joseph Leckie | 28,563 | 57.5 | +1.5 | |
| Labour | William Graham | 19,594 | 39.5 | -4.5 | |
| Christian Socialist | J A Harper | 1,480 | 3.0 | n/a | |
| Majority | 18.0 | +6.0 | |||
| Turnout | 75.3 | -11.0 | |||
| Liberal National hold | Swing | +3.0 | |||
| Party | Candidate | Votes | % | ± | |
|---|---|---|---|---|---|
| Liberal National | George Schuster | 28,720 | 57.1 | -0.4 | |
| Labour | George Jeger | 21,562 | 42.9 | +0.4 | |
| Majority | 7,158 | 14.2 | -0.8 | ||
| Turnout | 75.9 | ||||
| Liberal National hold | Swing | -0.4 | |||
Elections in the 1940s
General Election 1939/40:
Another General Election was required to take place before the end of 1940. The political parties had been making preparations for an election and by the end of the Autumn of 1939, the following candidates had been selected;
- Liberal National: George Schuster
- Labour: A J Stanley[22]
| Party | Candidate | Votes | % | ± | |
|---|---|---|---|---|---|
| Labour | William Wells | 28,324 | 53.9 | ||
| Liberal National | George Schuster | 24,197 | 46.1 | ||
| Majority | 4,127 | 7.8 | |||
| Turnout | 76.2 | ||||
| Labour gain from Liberal National | Swing | ||||
Elections in the 1950s
| Party | Candidate | Votes | % | ± | |
|---|---|---|---|---|---|
| Labour | William Wells | 36,483 | 56.0 | ||
| National Liberal and Conservative | John Barlow | 28,700 | 44.0 | ||
| Majority | 7,783 | 12.0 | |||
| Turnout | 86.2 | ||||
| Labour hold | Swing | ||||
| Party | Candidate | Votes | % | ± | |
|---|---|---|---|---|---|
| Labour | William Wells | 33,556 | 52.3 | ||
| Conservative | Frank Roper | 23,083 | 36.0 | ||
| Liberal | Barbara Lewis | 7,517 | 11.7 | ||
| Majority | 10,473 | 16.3 | |||
| Turnout | 83.1 | ||||
| Labour hold | Swing | ||||
References
- ↑ Craig, F.W.S., ed. (1972). Boundaries of parliamentary constituencies 1985-1972. Chichester, Sussex: Political Reference Publications. ISBN 0-900178-09-4.
- ↑ British parliamentary election results, 1885-1918 (Craig)
- ↑ British parliamentary election results, 1885-1918 (Craig)
- ↑ British parliamentary election results, 1885-1918 (Craig)
- ↑ British parliamentary election results, 1885-1918 (Craig)
- ↑ British parliamentary election results, 1885-1918 (Craig)
- ↑ British parliamentary election results, 1885-1918 (Craig)
- ↑ British parliamentary election results, 1885-1918 (Craig)
- ↑ British parliamentary election results, 1885-1918 (Craig)
- ↑ British parliamentary election results, 1885-1918 (Craig)
- ↑ British parliamentary election results, 1885-1918 (Craig)
- ↑ Black Country History
- ↑ British parliamentary election results 1918-1949 by FWS Craig
- ↑ British Parliamentary Election Results 1918-1949, FWS Craig
- ↑ British Parliamentary Election Results 1918-1949, FWS Craig
- ↑ British Parliamentary Election Results 1918-1949, FWS Craig
- ↑ British Parliamentary Election Results 1918-1949, FWS Craig
- ↑ British Parliamentary Election Results 1918-1949, FWS Craig
- ↑ British parliamentary election results 1918-1949 by FWS Craig
- ↑ British parliamentary election results 1918-1949 by FWS Craig
- ↑ British parliamentary election results 1918-1949 by FWS Craig
- ↑ Report of the Annual Conference, 1939
- ↑ British parliamentary election results 1918-1949 by FWS Craig
- ↑ British parliamentary election results 1950-1973 by FWS Craig
- ↑ The Times' Guide to the House of Commons. 1950.
- ↑ British parliamentary election results 1950-1973 by FWS Craig
- Craig, F. W. S. (1983) [1969]. British parliamentary election results 1918-1949 (3rd ed.). Chichester: Parliamentary Research Services. ISBN 0-900178-06-X.
- Leigh Rayment's Historical List of MPs – Constituencies beginning with "W" (part 1)