United States presidential approval rating
In the United States, presidential job approval ratings were introduced by George Gallup in the late 1930s (probably 1937) to gauge public support for the President of the United States during his term. An approval rating is a percentage determined by a polling which indicates the percentage of respondents to an opinion poll who approve of a particular person or program. Typically, an approval rating is given to a political figure based on responses to a poll in which a sample of people are asked whether they approve or disapprove of that particular political figure. A typical question might ask:
- "Do you approve or disapprove of the way [insert president] is handling [his/her] job as president?"[1]
Like most surveys that predict public opinion, the approval rating is subjective. Many unscientific approval rating systems exist that skew popular opinion. However, the approval rating is generally accepted as a statistically valid indicator of the comparative changes in the popular United States mood regarding a president.
President Donald Trump
Most recent polls for President Donald Trump:[2]
| Polling group | Date | Approval | Disapproval | Unsure | Net +/- | Sample size [3] | Population [3] |
|---|---|---|---|---|---|---|---|
| Rasmussen Reports[lower-alpha 1][4] | August 3-7, 2017 | 41% | 57% | 2% | -16% | ≈1,500 | Likely Voters |
| Gallup Poll[lower-alpha 2][5] | August 4-6, 2017 | 38% | 57% | 5% | -19% | ≈1,500 | All Adults |
| CBS News [lower-alpha 3][6] | August 3-6, 2017 | 36% | 58% | 6% | -22% | 1,111 | All Adults |
| CNN [lower-alpha 4][7] | August 3-6, 2017 | 38% | 56% | 5% | -18% | 1,018 | All Adults |
| Investor's Business Daily/TIPP | July 28-August 5, 2017 | 32% | 59% | 9% | -27% | 900 | All Adults |
| Quinnipiac University | July 27-August 1, 2017 | 33% | 61% | 6% | -28% | 1,125 | Registered Voters |
| Ipsos/Reuters[8] | July 27-31, 2017 | 37% | 59% | 4% | -22% | 3,797 | All Adults |
| Fox News [lower-alpha 5] | July 16-18, 2017 | 41% | 53% | 6% | -12% | 1,020 | Registered Voters |
| Public Policy Polling[9] | July 14-17, 2017 | 41% | 55% | 4% | -14% | 836 | Registered Voters |
| Monmouth University [10] | July 13-16, 2017 | 39% | 52% | 9% | -13% | 800 | All Adults |
| ABC News/Washington Post[lower-alpha 6][11] | July 10-13, 2017 | 36% | 58% | 6% | -22% | 1,001 | All Adults |
| Bloomberg News [lower-alpha 7][12] | July 8-12, 2017 | 40% | 56% | 4% | -16% | 1,001 | All Adults |
| Marist Poll | June 21–25, 2017 | 37% | 51% | 12% | -14% | 1,205 | All Adults |
| NBC News/Wall Street Journal[lower-alpha 8][13] | June 17-20, 2017 | 40% | 55% | 5% | -15% | 900 | All Adults |
| Pew Research Center | June 8–18, 2017 | 39% | 55% | 6% | -16% | 2,504 | All Adults |
| CNBC [lower-alpha 9] | June 9–12, 2017 | 37% | 51% | 12% | -14% | 800 | All Adults |
| National Opinion Research Center[3] | June 8–11, 2017 | 35% | 64% | 1% | -29% | 1,068 | All Adults |
President Barack Obama
Last polls for President Barack Obama:[14][15][16][17][18][19]
| Polling group | Date | Approval | Disapproval | Unsure | Sample size |
|---|---|---|---|---|---|
| Gallup Poll[lower-alpha 10] | January 17–19, 2017 | 59% | 37% | 4% | ≈1,500 |
| Rasmussen Reports[lower-alpha 11] | January 15–17, 2017 | 62% | 38% | 0% | ≈1,500 |
| Fox News[lower-alpha 12] | January 15–17, 2017 | 57% | 39% | 7% | 1,006 |
| CBS News[lower-alpha 13] | January 13–16, 2017 | 62% | 36% | 2% | 1,257 |
| ABC News/The Washington Post | January 12–15, 2017 | 60% | 38% | 2% | 1,005 |
| CNN/ORC | January 12–15, 2017 | 60% | 39% | 1% | 1,000 |
| Monmouth University | January 12–15, 2017 | 58% | 38% | 6% | 801 |
| NBC/The Wall Street Journal[lower-alpha 14] | January 12–15, 2017 | 56% | 40% | 4% | 1,000 |
| Quinnipiac University | January 5–9, 2017 | 55% | 39% | 5% | 899 |
| Pew Research Center | January 4–9, 2017 | 55% | 40% | 5% | 1,502 |
| Suffolk University/USA Today | December 14–18, 2016 | 54% | 41% | 5% | 1,000 |
| Bloomberg Politics[lower-alpha 15] | December 2–5, 2016 | 54% | 42% | 4% | 999 |
Historical comparison
Historical Gallup Poll approval highs and lows for each president since 1937:[20][21][22][lower-alpha 16]
| Order | President | Highest Approval | Lowest Approval | High – Low |
Highest Disapproval | Highest Margin | Lowest Margin | Final poll | Approval Average[20] |
Polls per year |
|---|---|---|---|---|---|---|---|---|---|---|
| 45[23] | Trump | 46 (01/24/17) | 35 (3/28/2017) | 11 | 60 (06/12/17, 08/01/17) | 1 (01/24/17) | −24 (03/28/17, 06/12/17, 08/01/17) | 39.8 | ||
| 44[24][25] | Obama | 69 (01/24/09) | 38 (09/05/14) [lower-alpha 17] | 31 | 57 (10/10/14) | 56 (01/23-24/09) | −18 (10/10/14) | 59 (01/19/17) | 47.9 | 348.4 |
| 43[26] | Bush (G.W.) | 90 (9/21/01) | 25 (10/05/08, 10/12/08, 11/02/08) | 65 | 71 (10/10/08) | 83 (09/22/01) | −46 (10/12/08) | 34 (01/11/09) | 49.4 | 33.7 |
| 42[27] | Clinton | 73 (12/19/98) | 37 (06/06/93) | 36 | 54 (09/07/94) | 45 (12/17/00) | −14 (09/07/94) | 66 (01/14/01) | 55.1 | 28.5 |
| 41[28] | Bush (G.H.W.) | 89 (02/28/91) | 29 (08/02/92, 10/13/92) | 60 | 60 (07/31/92) | 82 (03/03/91) | −30 (08/02/92, 10/13/92) | 56 (01/11/93) | 60.9 | 39.5 |
| 40[29] | Reagan | 71 (01/30/86) | 35 (01/31/83) | 36 | 56 (01/28/83) | 52 (01/30/86) | −21(01/31/83) | 63 (12/29/88) | 52.8 | 37.0 |
| 39[30] | Carter | 74 (03/15/77) | 28 (06/26/79, 10/02/79) | 46 | 59 (06/26/79) | 66 (03/15/77) | −31 (06/26/79) | 34 (12/08/80) | 45.5 | 22.7 |
| 38[31] | Ford | 70 (08/13/74) | 36 (03/25/75) | 34 | 46 (04/15/75, 11/18/75) | 26 (08/13/74) | −7 (02/25/75, 03/25/75, 04/15/75) | 53 (12/13/76) | 47.2 | 14.7 |
| 37[32] | Nixon | 66 (01/23/73) | 22 (01/02/74) | 44 | 66 (08/05/74) | 57 (03/17/69) | −42 (08/05/74) | 24 (08/05/74) | 49.1 | 17.7 |
| 36[33] | Johnson | 79 (03/05/64) | 34 (08/12/68) | 45 | 52 (08/12/68) | 75 (12/10/63) | −18 (08/12/68) | 49 (01/06/69) | 55.1 | 15.3 |
| 35[34] | Kennedy | 83 (03/05/62) | 56 (09/10/63) | 27 | 30 (09/12/63, 11/08/63) | 78 (03/05/62) | 27 (09/10/63) | 58 (11/13/63) | 70.1 | 13.7 |
| 34[35] | Eisenhower | 77 (11/22/55, 12/19/56) | 47 (03/25/58) | 30 | 36 (03/25/58) | 66 (04/02/53, 12/19/56) | 12 (03/25/58) | 59 (12/13/60) | 65.0 | 14.4 |
| 33[36] | Truman | 87 (08/22/45) | 22 (11/16/51, 02/14/52) | 65 | 67 (01/06/52) | 85(08/22/45) | −43 (01/04/52) | 32 (12/16/52) | 45.4 | 8.4 |
| 32[37] | Franklin D. Roosevelt | 83 (01/08/42) | 48 (08/18/39) | 35 | 46 (05/22/38, 05/29/38, 11/07/38) | 73 (01/23/42) | 65 (12/15/43) | 63 |
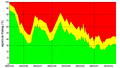
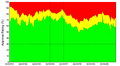
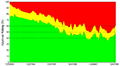
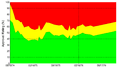
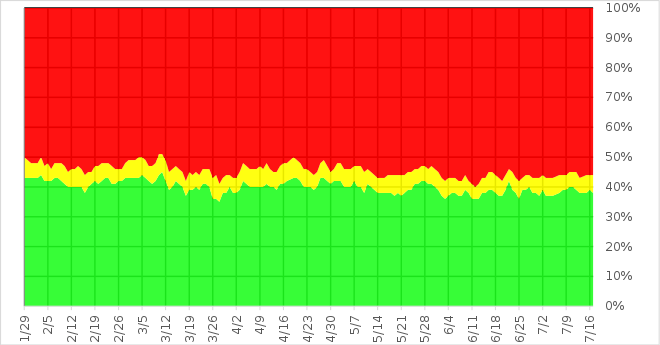
Graphs
| Gallup Poll graphs of approval ratings for Presidents of the United States: |


See also
- Historical rankings of Presidents of the United States
- Opinion polling on the Donald Trump administration
Notes
- ↑ Rolling 3-day average of 500 likely voters each day; no neutral/unsure choice
- ↑ Rolling 3-day average.
- ↑ Conducted by SSRS of Media, PA
- ↑ Conducted by SSRS
- ↑ Conducted by Anderson Robbins Research (D) and Shaw & Company Research (R)
- ↑ Conducted by Langer Research Associates
- ↑ Conducted by Selzer & Company
- ↑ Conducted by Hart Research Associates (D) and Public Opinion Strategies (R)
- ↑ Conducted by Hart Research Associates (D) and Public Opinion Strategies (R)
- ↑ Rolling 3-day average.
- ↑ Rolling 3-day average of 500 likely voters each day.
- ↑ Conducted by Anderson Robbins Research (D) and Shaw & Company Research (R).
- ↑ Conducted by SSRS of Media, PA.
- ↑ Conducted by the polling organizations of Peter D. Hart (D) and Bill McInturff (R).
- ↑ Conducted by Selzer and Co.
- ↑ Only the results of Gallup polls are included, as no other poll results exist for presidents before President Clinton.
- ↑ Last of eight, sometimes overlapping 3-day averages
References
- ↑ "Presidential Approval Ratings – Donald Trump". gallup.com. Retrieved February 13, 2017.
- ↑ "Trump - Polling Report". Retrieved January 27, 2017.
- 1 2 3 "How (un)popular is Donald Trump?". fivethirtyeight.com. Retrieved 14 May 2017.
- ↑ "Rasmussen Daily Presidential Tracking Poll". Retrieved June 17, 2017.
- ↑ "Gallup Daily: Trump Job Approval". Retrieved June 17, 2017.
- ↑ "Trump's approval rating remains low, but views on economy rise". CBS News. August 8, 2017.
- ↑ "Trump at 200 days" (PDF). August 7, 2017.
- ↑ "Trump approval at reuters.com". Retrieved June 17, 2017.
- ↑ "Democrats Have Big Enthusiasm Edge for 2018" (PDF). Public Policy Polling.
- ↑ "Does Trump-Russia Relationship Pose Security Threat? Public Split". Retrieved May 27, 2017.
- ↑ "Washington Post-ABC News poll July 10-13, 2017". Washington Post. July 16, 2017.
- ↑ "Bloomberg News National Poll". July 17, 2017.
- ↑ "NBC News/Wall Street Journal Survey" (PDF). Retrieved June 28, 2017.
- ↑ "President Obama: Job Ratings at PollingReport.com". Retrieved August 9, 2015.
- ↑ "Gallup Daily: Obama Job Approval". Retrieved August 14, 2016.
- ↑ "Daily Presidential Tracking Poll". Retrieved August 14, 2016.
- ↑ "At close of his administration, Obama’s approval among his best in years". Pew Research Center. January 19, 2017. Retrieved March 26, 2017.
- ↑ "Suffolk University/USA Today Final" (PDF). Retrieved July 16, 2017.
- ↑ "Assessing the Obama Presidency". January 18, 2017.
- 1 2 "Presidential Approval Ratings – Gallup Historical Statistics and Trends". Gallup.com. Retrieved August 16, 2011.
- ↑ Lydia Saad (March 29, 2017). "Trump's Approval Rating Unusually Low, Unusually Early". Gallup. Retrieved April 1, 2017.
- ↑ The American Presidency Project at UC Santa Barbara
- ↑ Inc., Gallup,. "Gallup Daily: Trump Job Approval". Gallup.com. Retrieved 2017-01-27.
- ↑ Graphical display and numbers of Gallup "daily tracking" polls
- ↑ "Presidential Approval Ratings -- Barack Obama".
- ↑ "Gallup.com". Gallup.com. Retrieved August 16, 2011.
- ↑ Inc., Gallup,. "Presidential Approval Ratings -- Bill Clinton". gallup.com. Retrieved January 26, 2017.
- ↑ Presidential Job Approval for George Bush at the American Presidency Project.
- ↑ Presidential Job Approval for Ronald Reagan at the American Presidency Project.
- ↑ Presidential Job Approval for Jimmy Carter at the American Presidency Project.
- ↑ Presidential Job Approval for Gerald Ford at the American Presidency Project.
- ↑ Presidential Job Approval for Richard Nixon at the American Presidency Project.
- ↑ Presidential Job Approval for Lyndon B. Johnson at the American Presidency Project.
- ↑ Presidential Job Approval for John F. Kennedy at the American Presidency Project.
- ↑ Presidential Job Approval for Dwight Eisenhower at the American Presidency Project.
- ↑ Presidential Job Approval for Harry Truman at the American Presidency Project.
- ↑ Presidential Job Approval for Franklin D. Roosevelt at the American Presidency Project.
External links
- Historical Presidential Job Performance Ratings – Roper Center
- Trump approval ratings at fivethirtyeight.com
- Historical Midterm Presidential Approval Ratings Data from Data360
- President Job Approval Ratings
- Historical Presidential Approval Ratings 1945–2009 from the Wall Street Journal
- President Obama's Ongoing Job Approval (CongressRatings)
| Presidents | |
|---|---|
| Professional careers | |
| Personal life | |
| Vice Presidents | |
| Succession | |
| Elections | |
| Candidates | |
| Families | |
| Namesakes, honors | |
| In fiction | |
US Government Portal • Biography Portal • | |