United Kingdom general election, 1900
United Kingdom general election, 1900
|
|---|
| 26 September – 24 October 1900 |
|
|
|
All 670 seats in the House of Commons
336 seats needed for a majority |
|---|
|
|

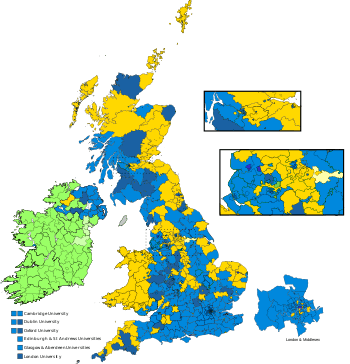
Colours denote the winning party. |
|
The United Kingdom general election of 1900 was held between 26 September and 24 October 1900, following the dissolution of Parliament on 25 September. Also known as the khaki election (the first of several elections to bear this sobriquet), it was held at a time when it was widely believed that the Second Boer War had effectively been won (though in fact it was to continue for a further two years). The Conservatives, led by Lord Salisbury with their Liberal Unionist allies, secured a large majority of 130, despite securing only 5.6% more votes than Henry Campbell-Bannerman's Liberals. This was largely due to the Conservatives winning 163 uncontested seats. The Labour Representation Committee, later to become the Labour Party, participated in a general election for the first time even though they had only been in existence for a few months. As a result, Keir Hardie and Richard Bell were the only LRC members of parliament in 1900.
This was the first time that Winston Churchill was elected to the House of Commons. He had stood in the same seat, Oldham, in a by-election the previous year, but had lost. It was also the final general election of the Victorian era and the 19th century.
Results
UK general election 1900
|
Candidates |
Votes |
| Party |
Leader |
Standing |
Elected |
Gained |
Unseated |
Net |
% of total |
% |
No. |
Net % |
| |
Conservative |
Lord Salisbury |
472 |
335 |
|
|
|
|
|
1,481,516 |
|
| |
Liberal Unionist |
Joseph Chamberlain |
97 |
67 |
|
|
|
|
|
286,442 |
|
| |
Conservative and Liberal Unionist |
Lord Salisbury |
569 |
402 |
32 |
41 |
−9 |
60.1 |
50.3 |
1,767,958 |
+1.3 |
| |
Liberal |
Henry Campbell-Bannerman |
402 |
183 |
38 |
32 |
+6 |
27.4 |
44.7 |
1,572,323 |
−1.0 |
| |
Labour |
Keir Hardie |
15 |
2 |
2 |
0 |
+2 |
3.0 |
1.8 |
62,698 |
N/A |
| |
Irish Parliamentary |
John Redmond |
83 |
77 |
2 |
7 |
−5 |
11.5 |
1.6 |
57,576 |
−2.4 |
| |
Independent Nationalist |
N/A |
18 |
5 |
5 |
0 |
+5 |
0.6 |
0.7 |
23,706 |
+0.6 |
| |
Independent Conservative |
N/A |
7 |
0 |
0 |
0 |
0 |
0 |
0.4 |
13,713 |
|
| |
Independent Liberal |
N/A |
3 |
1 |
1 |
0 |
+1 |
0.1 |
0.2 |
6,423 |
+0.1 |
| |
Independent |
N/A |
3 |
0 |
0 |
0 |
0 |
0 |
0.2 |
4,800 |
+0.2 |
| |
Scottish Workers |
Robert Allan |
1 |
0 |
0 |
0 |
0 |
0 |
0.1 |
3,107 |
N/A |
| |
Ind. Liberal Unionist |
N/A |
1 |
0 |
0 |
0 |
0 |
0 |
0.1 |
1,855 |
N/A |
| |
Ind. Labour Party |
Bruce Glasier |
1 |
0 |
0 |
0 |
0 |
0 |
0.0 |
433 |
+0.0 |
Total votes cast: 3,514,592. All parties with more than 1,000 votes shown.
Voting summary
| Popular vote |
|---|
|
|
|
|
|
| Conservative and Liberal Unionist |
|
50.3% |
| Liberal |
|
44.74% |
| Labour |
|
1.78% |
| Irish Parliamentary |
|
1.64% |
| Independent |
|
1.45% |
| Others |
|
0.99% |
Seats summary
| Parliamentary seats |
|---|
|
|
|
|
|
| Conservative and Liberal Unionist |
|
60% |
| Liberal |
|
27.31% |
| Labour |
|
0.3% |
| Irish Parliamentary |
|
11.49% |
| Independent Nationalist |
|
0.75% |
| Independent Liberal |
|
0.15% |
Regional results
.svg.png)
Largest party in each constituent country.
.svg.png)
Results within London & Middlesex.
Great Britain
England
Scotland
| Party |
Candidates |
Unopposed |
Seats |
Seats change |
Votes |
% |
% change |
|---|
|
Conservative & Liberal Unionist |
70 |
3 |
36 |
|
237,217 |
49.0 |
|
|
Liberal |
66 |
0 |
34 |
|
245,092 |
50.2 |
|
|
Other |
3 |
0 |
0 |
|
3,921 |
0.85 |
|
| Total |
139 |
3 |
70 |
 |
486,320 |
100 |
|
Wales
Ireland
Universities
See also
References
Further reading
- F. W. S. Craig, British Electoral Facts: 1832-1987 (1988).
- Garvin, J. L. The life of Joseph Chamberlain: volume Three 1895-1900 (London, 1934), pp 571–92 on dissolving Parliament; pp 593–607 on Khaki election.
- Hinton, Guy. "Newcastle and the Boer War: Regional Reactions to an Imperial War." Northern History 52.2 (2015): 272-294. online
- Marsh, Peter T. Joseph Chamberlain: Entrepreneur in Politics (1994) pp 492–502.
- Readman, Paul. "The Conservative party, patriotism, and British politics: the case of the general election of 1900." Journal of British Studies 40#1 (2001): 107-145. in JSTOR
- Roberts, Andrew. Salisbury: Victorian Titan (1999) pp 766–83
External links
.svg.png)
.svg.png)


