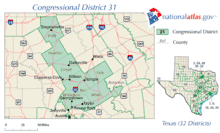
Texas's 31st congressional district
| Texas's 31st congressional district | |
|---|---|
|
Texas's 31st congressional district - since January 3, 2013. | |
| Current Representative | John Carter (R–Round Rock) |
| Population (2015) | 804,974[1] |
| Median income | 58,960[2] |
| Ethnicity |
|
| Cook PVI | R+10[3] |
Texas District 31 of the United States House of Representatives is a Congressional district that serves a strip of central Texas from north Austin up to Temple.
The district includes the portion of Austin located in Williamson County and most of the fast-growing northern suburbs of Austin, as well as a portion of the area surrounding Fort Hood.
John Carter has served as the representative from this district since its creation.
List of representatives
| Representative | Party | Years | Cong ress |
Electoral history |
|---|---|---|---|---|
| District created | January 3, 2003 | |||
 John Carter John Carter |
Republican | January 3, 2003 – Present |
108 109 110 111 112 113 114 |
First elected in 2002 Re-elected in 2004 Re-elected in 2006 Re-elected in 2008 Re-elected in 2010 Re-elected in 2012 Re-elected in 2014 |
Election results
| Party | Candidate | Votes | % | ± | |
|---|---|---|---|---|---|
| Republican | John Carter | 160,247 | 64.8 | | |
| Democratic | Jon Porter | 80,292 | 32.5 | | |
| Libertarian | Celeste Adams | 6,888 | 2.8 | | |
| Majority | 79,955 | 32.3 | |||
| Turnout | 247,427 | ||||
| Republican hold | Swing | -4.7 | |||
| Party | Candidate | Votes | % | ± | |
|---|---|---|---|---|---|
| Republican | John Carter | 94,242 | 58 | | |
| Democratic | Mary Beth Harrell | 62,761 | 39 | | |
| Libertarian | Matt McAdoo | 4,370 | 3 | | |
| Majority | 31,481 | 19 | | ||
| Turnout | 161,373 | | |||
| Republican hold | Swing | -6.7 | |||
| Party | Candidate | Votes | % | ± | |
|---|---|---|---|---|---|
| Republican | John Carter | 175,563 | 60.3 | | |
| Democratic | Brian P. Ruiz | 106,559 | 36.6 | | |
| Libertarian | Barry N. Cooper | 9,182 | 3.2 | | |
| Majority | 69,004 | 23.7 | | ||
| Turnout | 291,304 | | |||
| Republican hold | Swing | ||||
| Party | Candidate | Votes | % | ± | |
|---|---|---|---|---|---|
| Republican | John Carter | 126,384 | 82.6 | | |
| Libertarian | Bill Oliver | 26,735 | 17.5 | | |
| Majority | 99,649 | 65.1 | | ||
| Turnout | 153,119 | | |||
| Republican hold | Swing | ||||
| Party | Candidate | Votes | % | ± | |
|---|---|---|---|---|---|
| Republican | John Carter | 145,348 | 61.3 | | |
| Democratic | Stephen M. Wyman | 62,761 | 35.0 | | |
| Libertarian | Ethan Garofolo | 8,862 | 3.7 | | |
| Majority | 82,587 | 34.8 | | ||
| Turnout | 237,187 | | |||
| Republican hold | Swing | ||||
| Party | Candidate | Votes | % | ± | |
|---|---|---|---|---|---|
| Republican | John Carter | 91,484 | 64.1 | | |
| Democratic | Louie Minor | 45,634 | 32.0 | | |
| Libertarian | Scott Ballard | 5,693 | 4.0 | | |
| Majority | 45,850 | | |||
| Turnout | 142,811 | 18 | | ||
| Republican hold | Swing | ||||
| Party | Candidate | Votes | % | ± | |
|---|---|---|---|---|---|
| Republican | John Carter | 166,060 | 58.4 | | |
| Democratic | Mike Clark | 103,852 | 36.5 | | |
| Libertarian | Scott Ballard | 14,676 | 5.2 | | |
| Majority | 62,208 | | |||
| Turnout | 284,588 | 35 | | ||
| Republican hold | Swing | ||||
Historical district boundaries

See also
References
- ↑ https://www.census.gov/mycd/
- ↑ https://ballotpedia.org/Texas%27_31st_Congressional_District
- ↑ "Partisan Voting Index – Districts of the 115th Congress" (PDF). The Cook Political Report. April 7, 2017. Retrieved April 7, 2017.
Coordinates: 30°49′44″N 97°32′08″W / 30.82889°N 97.53556°W
This article is issued from
Wikipedia.
The text is licensed under Creative Commons - Attribution - Sharealike.
Additional terms may apply for the media files.
.tif.png)