East Surrey (UK Parliament constituency)
| East Surrey | |
|---|---|
|
County constituency for the House of Commons | |
|
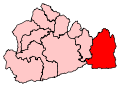
Boundary of East Surrey in Surrey. | |
|
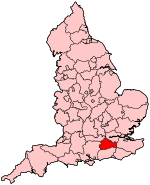
Location of Surrey within England. | |
| County | Surrey |
| Electorate | 77,145 (December 2010)[1] |
| Major settlements | Caterham, Whyteleafe, Warlingham, Lingfield, Woldingham, Godstone, Horley, Oxted, Limpsfield, Tatsfield |
| Current constituency | |
| Created | 1918 |
| Member of parliament | Sam Gyimah (Conservative) |
| Number of members | One |
| 1832–1885 | |
| Number of members | Two |
| Type of constituency | County constituency |
| Replaced by |
Croydon division Reigate division, Clapham Dulwich |
| Created from | Bletchingley, Gatton and Surrey |
| Overlaps | |
| European Parliament constituency | South East England |
| During its existence contributed to new seat(s) of: | Mid Surrey (in 1868) |
East Surrey is a constituency[n 1] represented in the House of Commons of the UK Parliament since 2010 by Sam Gyimah of the Conservative Party.[n 2] Its record is that of a Tory safe seat based on time and opposition. It has elected a Conservative Party MP on an absolute majority since its establishment, in 1918, and its greatest share of the vote for any opposition candidate was 33.75% in February 1974.
Boundaries
1832-1868: The Hundreds of Brixton, Kingston, Reigate, Tandridge and Wallington.[2]
1868-1885: The Hundred of Tandridge, and so much of the Hundred of Wallington as included and lay to the east of the parishes of Croydon and Sanderstead, and so much of the Hundred of Brixton as included and lay to the east of the parishes of Streatham, Clapham and Lambeth.[3]
1918-1950: The Urban Districts of Caterham, and Coulsdon and Purley, and the Rural District of Godstone.
1950-1974: The Urban Districts of Caterham and Warlingham, and Coulsdon and Purley.
1974-1983: The Urban District of Caterham and Warlingham, and the Rural District of Godstone.
1983-1997: The District of Tandridge.
1997-2010: The District of Tandridge, and the Borough of Reigate and Banstead wards of Horley East and Horley West.
2010-present: As above plus Horley Central.
Constituency profile
East Surrey is a well-connected inner Home Counties seat, combining the town of Horley with Surrey's residual District Tandridge (as opposed to Boroughs which the other 10 parts have been created) which is made up of Caterham and modest commuter settlements, farming and retirement homes. Horley is one of two towns adjoining London Gatwick Airport and part of Reigate and Banstead borough. The area borders the London Borough of Croydon to the north, the county of Kent to the east, and the county of West Sussex to the south.
The northern part of the seat is inside the M25 motorway — Caterham, Whyteleafe and Warlingham form green-buffered, elevated commuter belt, with good rail connections to Central London and well-connected by all modes of transport to Croydon. Elsewhere the seat is more rural and includes a low part of the Greensand Ridge and features woodland and many golf courses.
Conservatives have prevented any opposition party achieving more than 33.75% of the vote since 1974, including at the 1997 and 2001 UK General Elections when opposition was greatest nationally in Conservative safer seats.
Most local wards are won by the Conservatives with the Liberal Democrats often picking up seats somewhere in the dual-council system, particularly in Whyteleafe or Caterham Valley. As is typical in seats of this kind, the Labour vote is typically very modest, with the party finishing in third place in every General Election since 1959, until a rise to second place in 2017, this has been suggested its suggested to a "Corbyn-Surge". The early 21st century saw UKIP poll approximately as strongly as Lib Dems historically. The area saw a majority in favour of Brexit in the 2016 Referendum whereas the incumbent MP Sam Gyimah opposed Brexit.
History
The territory, reduced as neighbouring seats have been created or enlarged, on inception absorbed Surrey's parliamentary boroughs of Bletchingley and Gatton, abolished as rotten boroughs by the Great Reform Act, 1832.
An earlier constituency of the same name existed from 1832 to 1885. Formally and often known as the Eastern Division of Surrey or Surrey Eastern, it elected two MPs by the bloc vote system. It was created in the 1832 Reform Acts and covered land from Peckham and southern Brixton adjoining Southwark to Lingfield adjoining Sussex[4] and from Kent to Capel and Kingston upon Thames, the latter adjoining one of Surrey's then western borders.
Central parts of Surrey, a county which then extended far into today's Greater London, were identified as requiring two MPs under the Second Reform Act, starting from the 1868 general election. Surrey benefited under this Reform Act 1867, which reduced malapportionment varyingly. From 1832 until 1867 the seat included a populous northern section being all of South London except for the Kentish parts of the South East London, Lambeth and Southwark.
The Redistribution of Seats Act 1885 went much further than the Reform Act 1832 towards equal representation around the country, and also reflected growth in the county's population. Thus for elections from 1885 onwards, Mid Surrey and Surrey Eastern were split into Chertsey, Croydon, Epsom, Kingston, Reigate and Wimbledon constituencies (seats formerly included in Surrey Eastern are in bold).
In 1918 the constituency was re-established as East Surrey, taking rural and at most small suburban parts of Reigate and Croydon, and for the first time electing only one MP. It covered a smaller area, from the south of Croydon to the Kent and West Sussex borders. It included Lingfield, Oxted, Limpsfield, Godstone, Caterham and Woldingham.
In 1950 East Surrey lost Addington parish on the eastern fringe of Croydon to the newly formed Croydon South constituency, and its southern half to the Reigate constituency. In 1974 much of the north of constituency became part of Croydon South, reflecting the 1965 transfer of Purley and Coulsdon to the London Borough of Croydon in the new Greater London which then replaced the London County Council. Surrey East took in much of the area to the south that had been in Reigate since 1950. Its MP until 1974, William Clark, won the new Croydon South in that year's February election. Clark's successor, Sir Geoffrey Howe, later became Chancellor of the Exchequer and Foreign Secretary in Margaret Thatcher's cabinet.
Members of Parliament
MPs 1832–1885
| Election | First member[5] | 1st Party[6] | Second member[5] | 2nd Party[6] | ||
|---|---|---|---|---|---|---|
| 1832 | John Ivatt Briscoe | Liberal | Aubrey Beauclerk | Liberal | ||
| 1835 | Richard Alsager | Conservative | ||||
| 1837 | Henry Kemble | Conservative | ||||
| 1841 by-election | Edmund Antrobus | Conservative | ||||
| 1847 | Peter John Locke King | Liberal | Thomas Alcock | Liberal | ||
| 1865 | Charles Buxton | Liberal | ||||
| 1871 by-election | James Watney | Conservative | ||||
| 1874 | William Grantham | Conservative | ||||
| 1885 | Constituency abolished | |||||
MPs since 1918
| Election | Member[5] | Party | Notes | ||
|---|---|---|---|---|---|
| Constituency recreated | |||||
| 1918 | Sir Stuart Coats, Bt | Conservative | |||
| 1922 | James Galbraith | Conservative | |||
| 1935 | Charles Emmott | Conservative | |||
| 1945 | Michael Astor | Conservative | |||
| 1951 | Charles Doughty | Conservative | |||
| 1970 | William Clark | Conservative | |||
| Feb 1974[7] | Geoffrey Howe | Conservative | Later Lord Howe of Aberavon; Cabinet minister 1979–1990 | ||
| 1992 | Peter Ainsworth | Conservative | |||
| 2010 | Sam Gyimah | Conservative | |||
Elections
Elections in the 2010s
| Party | Candidate | Votes | % | ± | |
|---|---|---|---|---|---|
| Conservative | Sam Gyimah [8] | 35,310 | 59.6 | +2.2 | |
| Labour | Hitesh Tailor [9] | 11,396 | 19.2 | +7.4 | |
| Liberal Democrat | David Lee [10] | 6,197 | 10.5 | +1.2 | |
| Independent | Andy Parr | 2,973 | 5.0 | +5.0 | |
| UKIP | Helena Windsor | 2,227 | 3.8 | -13.3 | |
| Green | Benedict Southworth | 1,100 | 1.9 | -2.0 | |
| Majority | 23,914 | 40.4 | |||
| Turnout | 59,203 | 74.9 | +4.5 | ||
| Conservative hold | Swing | -2.6 | |||
| Party | Candidate | Votes | % | ± | |
|---|---|---|---|---|---|
| Conservative | Sam Gyimah | 32,211 | 57.4 | +0.7 | |
| UKIP | Helena Windsor | 9,553 | 17.0 | +10.1 | |
| Labour | Matt Wilson | 6,627 | 11.8 | +2.8 | |
| Liberal Democrat | David Lee | 5,189 | 9.2 | -16.6 | |
| Green | Nicola Dodgson | 2,159 | 3.8 | N/A | |
| Independent | Sandy Pratt | 364 | 0.6 | N/A | |
| Majority | 22,658 | 40.4 | |||
| Turnout | 56,103 | 70.4 | −0.7 | ||
| Conservative hold | Swing | -4.7 | |||
| Party | Candidate | Votes | % | ± | |
|---|---|---|---|---|---|
| Conservative | Sam Gyimah | 31,007 | 56.7 | +0.6 | |
| Liberal Democrat | David Lee | 14,133 | 25.9 | +2.0 | |
| Labour | Mathew Rodda | 4,925 | 9.0 | -5.8 | |
| UKIP | Helena Windsor | 3,770 | 6.9 | +2.5 | |
| Monster Raving Loony | Martin Hogbin | 422 | 0.8 | N/A | |
| Independent | Sandy Pratt | 383 | 0.7 | N/A | |
| Majority | 16,874 | 30.9 | |||
| Turnout | 54,640 | 71.1 | +4.5 | ||
| Conservative hold | Swing | ||||
Elections in the 2000s
| Party | Candidate | Votes | % | ± | |
|---|---|---|---|---|---|
| Conservative | Peter Ainsworth | 27,659 | 56.2 | +3.7 | |
| Liberal Democrat | Jeremy Pursehouse | 11,738 | 23.8 | -0.6 | |
| Labour | James Bridge | 7,288 | 14.8 | -4.3 | |
| UKIP | Tony Stone | 2,158 | 4.4 | +0.5 | |
| Legalise Cannabis | Winston Matthews | 410 | 0.8 | +0.8 | |
| Majority | 15,921 | 32.3 | |||
| Turnout | 49,253 | 66.6 | +3.3 | ||
| Conservative hold | Swing | +2.1 | |||
| Party | Candidate | Votes | % | ± | |
|---|---|---|---|---|---|
| Conservative | Peter Ainsworth | 24,706 | 52.5 | +2.4 | |
| Liberal Democrat | Jeremy Pursehouse | 11,503 | 24.4 | +1.9 | |
| Labour | Jo Tanner | 8,994 | 19.1 | -2.1 | |
| UKIP | Tony Stone | 1,846 | 3.9 | +2.9 | |
| Majority | 13,203 | 28.1 | |||
| Turnout | 47,049 | 63.3 | -11.4 | ||
| Conservative hold | Swing | ||||
Elections in the 1990s
| Party | Candidate | Votes | % | ± | |
|---|---|---|---|---|---|
| Conservative | Peter Ainsworth | 27,389 | 50.1 | -10.9 | |
| Liberal Democrat | Belinda Ford | 12,296 | 22.5 | -4.4 | |
| Labour | David Ross | 11,573 | 21.2 | +10.7 | |
| Referendum | Michael Sydney | 2,656 | 4.9 | ||
| UKIP | Tony Stone | 569 | 1.0 | ||
| Natural Law | Susan Bartrum | 173 | 0.3 | ||
| Majority | 15,093 | 27.6 | |||
| Turnout | 54,656 | 74.6 | |||
| Conservative hold | Swing | ||||
This constituency underwent boundary changes between the 1992 and 1997 general elections and thus change in share of vote is based on a notional calculation.
| Party | Candidate | Votes | % | ± | |
|---|---|---|---|---|---|
| Conservative | Peter Ainsworth | 29,767 | 62.3 | −1.1 | |
| Liberal Democrat | Robert L. Tomlin | 12,111 | 25.4 | +1.4 | |
| Labour | Gill M. Roles | 5,075 | 10.6 | +0.2 | |
| Green | Ian T. Kilpatrick | 819 | 1.7 | −0.6 | |
| Majority | 17,656 | 37.0 | −2.5 | ||
| Turnout | 47,772 | 82.3 | +5.2 | ||
| Conservative hold | Swing | −1.2 | |||
Elections in the 1980s
| Party | Candidate | Votes | % | ± | |
|---|---|---|---|---|---|
| Conservative | Geoffrey Howe | 29,126 | 63.4 | +0.5 | |
| Liberal | Michael Anderson | 11,000 | 23.9 | −3.4 | |
| Labour | Michael Davis | 4,779 | 10.4 | +0.6 | |
| Green | David Newell | 1,044 | 2.3 | ||
| Majority | 18,126 | 39.5 | |||
| Turnout | 45,949 | 77.2 | |||
| Conservative hold | Swing | ||||
| Party | Candidate | Votes | % | ± | |
|---|---|---|---|---|---|
| Conservative | Geoffrey Howe | 27,272 | 62.9 | ||
| Liberal | Susan Liddell | 11,836 | 27.3 | ||
| Labour | Hugh Pincott | 4,249 | 9.8 | ||
| Majority | 15,436 | 35.6 | |||
| Turnout | 43,357 | 74.1 | |||
| Conservative hold | Swing | ||||
Elections in the 1970s
| Party | Candidate | Votes | % | ± | |
|---|---|---|---|---|---|
| Conservative | Geoffrey Howe | 28,266 | 62.84 | ||
| Liberal | Susan Liddell | 8,866 | 19.71 | ||
| Labour | Graham Harries | 7,398 | 16.45 | ||
| National Front | D. Smith | 452 | 1.00 | ||
| Majority | 19,400 | 43.13 | |||
| Turnout | 78.42 | ||||
| Conservative hold | Swing | ||||
| Party | Candidate | Votes | % | ± | |
|---|---|---|---|---|---|
| Conservative | Geoffrey Howe | 22,227 | 52.41 | ||
| Liberal | Kenneth Vaus | 12,382 | 29.20 | ||
| Labour | David Allonby | 7,797 | 18.39 | ||
| Majority | 9,845 | 23.22 | |||
| Turnout | 76.17 | ||||
| Conservative hold | Swing | ||||
| Party | Candidate | Votes | % | ± | |
|---|---|---|---|---|---|
| Conservative | Geoffrey Howe | 23,563 | 51.16 | ||
| Liberal | Kenneth Vaus | 15,544 | 33.75 | ||
| Labour | David Allonby | 6,946 | 15.08 | ||
| Majority | 8,019 | 17.41 | |||
| Turnout | 83.58 | ||||
| Conservative hold | Swing | ||||
| Party | Candidate | Votes | % | ± | |
|---|---|---|---|---|---|
| Conservative | William Clark | 35,773 | 61.99 | ||
| Liberal | Percy W. Meyer | 11,749 | 20.36 | ||
| Labour | Michael D. Simmons | 10,186 | 17.65 | ||
| Majority | 24,024 | 41.63 | |||
| Turnout | 73.08 | ||||
| Conservative hold | Swing | ||||
Elections in the 1960s
| Party | Candidate | Votes | % | ± | |
|---|---|---|---|---|---|
| Conservative | Charles Doughty | 30,900 | 54.54 | ||
| Liberal | Michael R Lane | 16,407 | 28.96 | ||
| Labour | Cyril Shaw | 9,347 | 16.50 | ||
| Majority | 14,493 | 25.58 | |||
| Turnout | 79.33 | ||||
| Conservative hold | Swing | ||||
| Party | Candidate | Votes | % | ± | |
|---|---|---|---|---|---|
| Conservative | Charles Doughty | 31,827 | 55.94 | ||
| Liberal | Michael R Lane | 16,049 | 28.21 | ||
| Labour | James Stewart Cook | 9,020 | 15.85 | ||
| Majority | 15,778 | 27.73 | |||
| Turnout | 79.22 | ||||
| Conservative hold | Swing | ||||
Elections in the 1950s
| Party | Candidate | Votes | % | ± | |
|---|---|---|---|---|---|
| Conservative | Charles Doughty | 36,310 | 63.94 | ||
| Liberal | Kenneth Vaus | 10,376 | 18.27 | ||
| Labour | James C Hunt | 10,102 | 17.79 | ||
| Majority | 25,934 | 45.67 | |||
| Turnout | 81.13 | ||||
| Conservative hold | Swing | ||||
| Party | Candidate | Votes | % | ± | |
|---|---|---|---|---|---|
| Conservative | Charles Doughty | 37,276 | 74.79 | ||
| Labour | Jean Graham Hall | 12,567 | 25.21 | ||
| Majority | 24,709 | 49.57 | |||
| Turnout | 76.47 | ||||
| Conservative hold | Swing | ||||
| Party | Candidate | Votes | % | ± | |
|---|---|---|---|---|---|
| Conservative | Charles Doughty | 37,966 | 72.98 | ||
| Labour | Nathan Whine | 14,056 | 27.02 | ||
| Majority | 23,910 | 45.96 | |||
| Turnout | 81.30 | ||||
| Conservative hold | Swing | ||||
| Party | Candidate | Votes | % | ± | |
|---|---|---|---|---|---|
| Conservative | Michael Astor | 32,711 | 60.92 | ||
| Labour | Nathan Whine | 12,499 | 23.28 | ||
| Liberal | Wendy Wills | 8,484 | 15.80 | ||
| Majority | 20,212 | 37.64 | |||
| Turnout | 87.17 | ||||
| Conservative hold | Swing | ||||
Election in the 1940s
| Party | Candidate | Votes | % | ± | |
|---|---|---|---|---|---|
| Conservative | Michael Astor | 31,117 | 53.36 | ||
| Labour | Henry Edward Weaver | 17,708 | 30.36 | ||
| Liberal | Donald Phillip Owen | 9,495 | 16.28 | ||
| Majority | 13,409 | 22.99 | |||
| Turnout | 74.50 | ||||
| Conservative hold | Swing | ||||
Elections in the 1930s
General Election 1939/40:
Another General Election was required to take place before the end of 1940. The political parties had been making preparations for an election to take place from 1939 and by the end of this year, the following candidates had been selected;
- Conservative: Charles Emmott
- Labour:
| Party | Candidate | Votes | % | ± | |
|---|---|---|---|---|---|
| Conservative | Charles Emmott | 33,776 | 78.91 | ||
| Labour | Henry Edward Weaver | 9,025 | 21.09 | ||
| Majority | 24,751 | 57.83 | |||
| Turnout | 66.54 | ||||
| Conservative hold | Swing | ||||
| Party | Candidate | Votes | % | ± | |
|---|---|---|---|---|---|
| Conservative | James Galbraith | 33,771 | 88.85 | ||
| Labour | Mont Follick | 4,236 | 11.15 | ||
| Majority | 29,535 | 77.71 | |||
| Turnout | 71.40 | ||||
| Conservative hold | Swing | ||||
Elections in the 1920s
| Party | Candidate | Votes | % | ± | |
|---|---|---|---|---|---|
| Unionist | James Galbraith | 19,578 | 60.9 | ||
| Liberal | Ida Swinburne | 7,435 | 23.1 | ||
| Labour | Robert Oscar Mennell | 5,152 | 16.0 | ||
| Majority | 12,143 | 37.8 | |||
| Turnout | |||||
| Unionist hold | Swing | ||||
| Party | Candidate | Votes | % | ± | |
|---|---|---|---|---|---|
| Unionist | James Galbraith | 15,999 | 83.1 | n/a | |
| Labour | Robert Oscar Mennell | 3,249 | 16.9 | n/a | |
| Majority | 12,750 | 66.2 | n/a | ||
| Turnout | 70.7 | n/a | |||
| Unionist hold | Swing | n/a | |||
| Party | Candidate | Votes | % | ± | |
|---|---|---|---|---|---|
| Unionist | James Galbraith | unopposed | n/a | n/a | |
| Unionist hold | Swing | n/a | |||
| Party | Candidate | Votes | % | ± | |
|---|---|---|---|---|---|
| Unionist | James Galbraith | 12,498 | 77.3 | -5.5 | |
| Labour | Marjorie Pease | 3,667 | 22.7 | n/a | |
| Majority | 8,831 | 54.6 | -11.0 | ||
| Turnout | 64.5 | +17.4 | |||
| Unionist hold | Swing | n/a | |||
Elections in the 1910s
| Party | Candidate | Votes | % | ± | |
|---|---|---|---|---|---|
| Unionist | 8,795 | 82.8 | n/a | ||
| Liberal | Guy Hayler | 1,830 | 17.2 | n/a | |
| Majority | 6,965 | 65.6 | n/a | ||
| Turnout | 47.1 | n/a | |||
| Unionist win | |||||
- endorsed by Coalition Government
See also
- 2005 United Kingdom general election result in Surrey
- List of Parliamentary constituencies in Surrey
Notes and references
- Notes
- ↑ A county constituency (for the purposes of election expenses and type of returning officer)
- ↑ As with all constituencies, the constituency elects one Member of Parliament (MP) by the first past the post system of election at least every five years.
- References
- ↑ "Electorate figures – Boundary Commission for England". 2011 Electorate Figures. Boundary Commission for England. 4 March 2011. Archived from the original on 6 November 2010. Retrieved 13 March 2011.
- ↑ "The statutes of the United Kingdom of Great Britain and Ireland. 2 & 3 William IV. Cap. LXIV. An Act to settle and describe the Divisions of Counties, and the Limits of Cities and Boroughs, in England and Wales, in so far as respects the Election of Members to serve in Parliament.". London: His Majesty's statute and law printers. 1832. pp. 300–383. Retrieved 2017-07-27.
- ↑ "Representation of the People Act 1867." (PDF). Retrieved 2017-07-27.
- ↑ Commissioners on Proposed Division of Counties and Boundaries of Boroughs (1832). Parliamentary representation: further return to an address to His Majesty, dated 12 December, 1831; for copies of instructions given by the Secretary of State for the Home department with reference to Parliamentary representation; likewise copies of letters of reports received by the Secretary of state for the Home department in answer to such instructions. London. pp. 125–126.
- 1 2 3 Leigh Rayment's Historical List of MPs – Constituencies beginning with "S" (part 6)
- 1 2 Craig, F. W. S. (1989) [1977]. British parliamentary election results 1832–1885 (2nd ed.). Chichester: Parliamentary Research Services. pp. 465–466. ISBN 0-900178-26-4.
- ↑ Major boundary changes to the constituency took place for this election
- ↑ https://www.eastsurreyconservatives.org.uk/news/sam-gyimah-selected-stand-parliamentary-candidate
- ↑ http://www.labour.org.uk/pages/general-election-2017-candidate-list-a-m
- ↑ http://eastsurreylibdems.org.uk/elections-2017/general-election/284-your-lib-dem-candidate-david-lee
- ↑ "Election Data 2015". Electoral Calculus. Archived from the original on 17 October 2015. Retrieved 17 October 2015.
- ↑ http://www.bbc.co.uk/news/politics/constituencies/E14000681
- ↑ "Election Data 2010". Electoral Calculus. Archived from the original on 26 July 2013. Retrieved 17 October 2015.
- ↑ "Election Data 2005". Electoral Calculus. Archived from the original on 15 October 2011. Retrieved 18 October 2015.
- ↑ "Election Data 2001". Electoral Calculus. Archived from the original on 15 October 2011. Retrieved 18 October 2015.
- ↑ "Election Data 1997". Electoral Calculus. Archived from the original on 15 October 2011. Retrieved 18 October 2015.
- ↑ "Election Data 1992". Electoral Calculus. Archived from the original on 15 October 2011. Retrieved 18 October 2015.
- ↑ "Politics Resources". Election 1992. Politics Resources. 9 April 1992. Retrieved 2010-12-06.
- ↑ "Election Data 1987". Electoral Calculus. Archived from the original on 15 October 2011. Retrieved 18 October 2015.
- ↑ "Election Data 1983". Electoral Calculus. Archived from the original on 15 October 2011. Retrieved 18 October 2015.
- 1 2 3 4 5 British Parliamentary Election Results 1918–1949, FWS Craig
Sources
- Election result, 2010 BBC News
- Election result, 2005 BBC News
- Election results, 1997 – 2001 BBC News
- Election results, 1997 – 2001 Election Demon
- Election results, 1983 – 1992 Election Demon
- Election results, 1992 – 2010 The Guardian
- Election results, 1945 – 1979 Politics Resources
| Parliament of the United Kingdom | ||
|---|---|---|
| Preceded by Leeds East |
Constituency represented by the Chancellor of the Exchequer 1979–1983 |
Succeeded by Blaby |