Solar eclipse of May 10, 2013
| Solar eclipse of May 10, 2013 | |
|---|---|
|
Annularity viewed from Churchills Head, Australia. | |
 Map | |
| Type of eclipse | |
| Nature | Annular |
| Gamma | -0.2694 |
| Magnitude | 0.9544 |
| Maximum eclipse | |
| Duration | 363 sec (6 m 3 s) |
| Coordinates | 2°12′N 175°30′E / 2.2°N 175.5°E |
| Max. width of band | 173 km (107 mi) |
| Times (UTC) | |
| (P1) Partial begin | 21:25:10 |
| (U1) Total begin | 22:30:34 |
| Greatest eclipse | 0:26:20 |
| (U4) Total end | 2:19:58 |
| (P4) Partial end | 3:25:23 |
| References | |
| Saros | 138 (31 of 70) |
| Catalog # (SE5000) | 9537 |
An annular solar eclipse took place on May 9–10 (UTC), 2013, with a magnitude of 0.9544. A solar eclipse occurs when the Moon passes between Earth and the Sun, thereby totally or partly obscuring the image of the Sun for a viewer on Earth. An annular solar eclipse occurs when the Moon's apparent diameter is smaller than the Sun's, blocking most of the Sun's light and causing the Sun to look like an annulus (ring). An annular eclipse appears as a partial eclipse over a region of the Earth thousands of kilometres wide.
Visibility
Animation of eclipse path |
 Eclipse path |
Annularity was visible from a 171 to 225 kilometre-wide track that traversed Australia, eastern Papua New Guinea, the Solomon Islands, and the Gilbert Islands, with the maximum of 6 minutes 3 seconds visible from the Pacific Ocean east of French Polynesia.
Images
- Simulation of greatest annularity east of Marakei, Kiribati.
- Partial eclipse from Canberra, Australia at 7:55 am local time (May 9 at 21:55 UMT)
 Eclipse shadows from a coconut leaf shadow. From Tarawa, Kiribati at 12:30 pm local time (00:30 UMT)
Related eclipses
Solar eclipses 2011-2014
Each member in a semester series of solar eclipses repeats approximately every 177 days and 4 hours (a semester) at alternating nodes of the Moon's orbit. Note: Partial solar eclipses on January 4, 2011, and July 1, 2011, occur in the previous semester series.
| Solar eclipse series sets from 2011–14 | ||||
|---|---|---|---|---|
| Descending node | Ascending node | |||
| Saros | Map | Saros | Map | |
118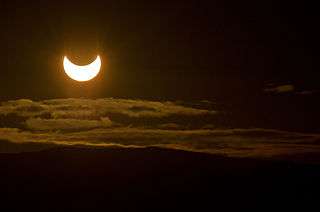 Partial from Tromsø, Norway |
June 1, 2011 Partial |
123 | November 25, 2011 Partial | |
128 Middlegate, Nevada |
May 20, 2012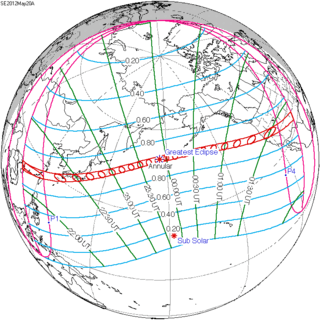 Annular |
133 Ellis Beach, Queensland |
November 13, 2012 Total | |
| 138 Churchills Head, Australia |
May 10, 2013 Annular |
143 Partial from Accra, Ghana |
November 3, 2013 Hybrid | |
| 148 | April 29, 2014 Annular |
153 Partial from Minneapolis, MN |
October 23, 2014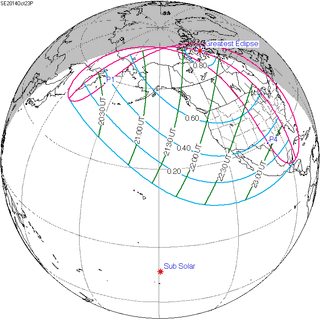 Partial | |
Tritos series
This eclipse is a part of a tritos cycle, repeating at alternating nodes every 135 synodic months (≈ 3986.63 days, or 11 years minus 1 month). Their appearance and longitude are irregular due to a lack of synchronization with the anomalistic month (period of perigee), but groupings of 3 tritos cycles (≈ 33 years minus 3 months) come close (≈ 434.044 anomalistic months), so eclipses are similar in these groupings.
| Series members between 1901 and 2100 | |||
|---|---|---|---|
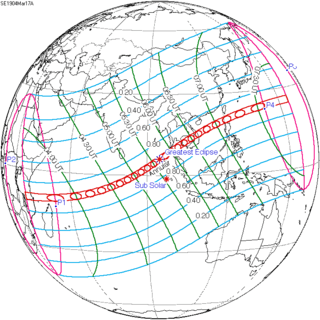 March 17, 1904 (Saros 128) |
 February 14, 1915 (Saros 129) |
 January 14, 1926 (Saros 130) | |
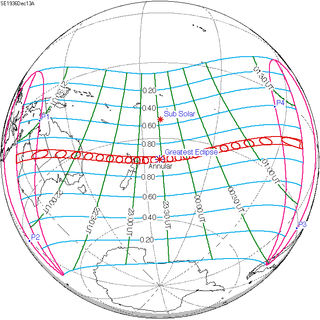 December 13, 1936 (Saros 131) |
 November 12, 1947 (Saros 132) |
 October 12, 1958 (Saros 133) | |
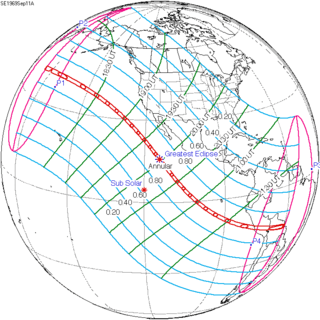 September 11, 1969 (Saros 134) |
 August 10, 1980 (Saros 135) |
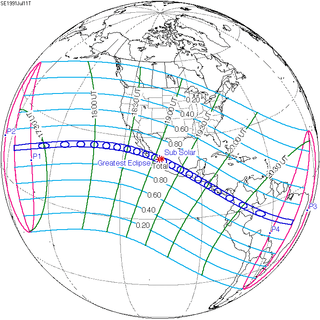 July 11, 1991 (Saros 136) | |
 June 10, 2002 (Saros 137) |
 May 10, 2013 (Saros 138) |
 April 8, 2024 (Saros 139) | |
 March 9, 2035 (Saros 140) |
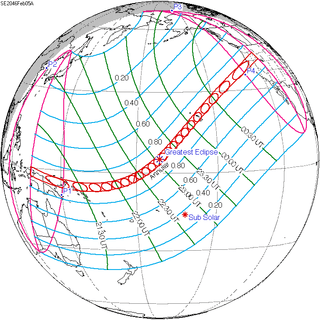 February 5, 2046 (Saros 141) |
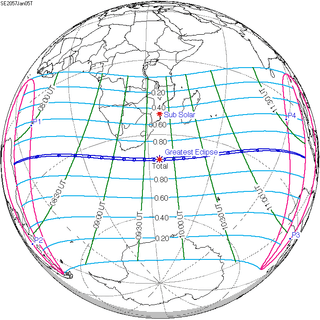 January 5, 2057 (Saros 142) | |
 December 6, 2067 (Saros 143) |
 November 4, 2078 (Saros 144) |
 October 4, 2089 (Saros 145) | |
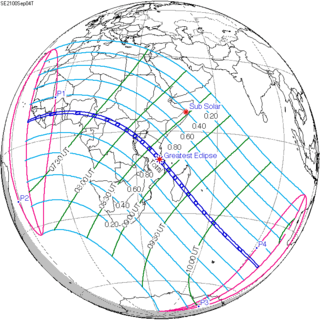 September 4, 2100 (Saros 146) |
|||
Metonic cycle
The metonic series repeats eclipses every 19 years (6939.69 days), lasting about 5 cycles. Eclipses occur in nearly the same calendar date. In addition the octon subseries repeats 1/5 of that or every 3.8 years (1387.94 days).
| 21 events between July 22, 1971 and July 22, 2047 | ||||
|---|---|---|---|---|
| July 21-22 | May 9-11 | February 26-27 | December 14-15 | October 2-3 |
| 116 | 118 | 120 | 122 | 124 |
 July 22, 1971 |
 May 11, 1975 |
 February 26, 1979 |
 December 15, 1982 |
 October 3, 1986 |
| 126 | 128 | 130 | 132 | 134 |
 July 22, 1990 |
 May 10, 1994 |
 February 26, 1998 |
 December 14, 2001 |
 October 3, 2005 |
| 136 | 138 | 140 | 142 | 144 |
 July 22, 2009 |
 May 10, 2013 |
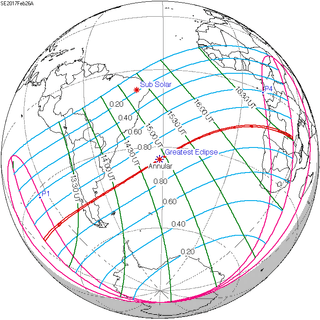 February 26, 2017 |
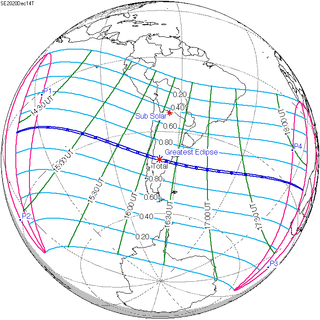 December 14, 2020 |
 October 2, 2024 |
| 146 | 148 | 150 | 152 | 154 |
 July 22, 2028 |
 May 9, 2032 |
 February 27, 2036 |
 December 15, 2039 |
 October 3, 2043 |
| 156 | ||||
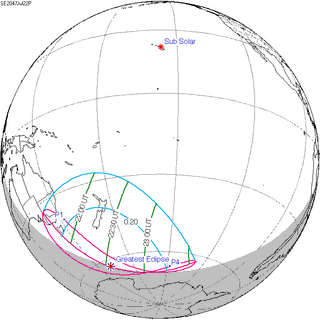 July 22, 2047 | ||||
References
| Wikimedia Commons has media related to Solar eclipse of 2013 May 10. |
- Earth visibility chart and eclipse statistics Eclipse Predictions by Fred Espenak, NASA/GSFC
- Photos:
- Cape York Annular Eclipse APOD, 5/11/13
- Partial Solar Eclipse with Airplane APOD, 5/13/13