Sioux County, Nebraska
| Sioux County, Nebraska | |
|---|---|
 Sioux County Courthouse in Harrison | |
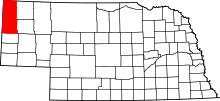 Location in the U.S. state of Nebraska | |
 Nebraska's location in the U.S. | |
| Founded | 1877 |
| Named for | Sioux people |
| Seat | Harrison |
| Largest village | Harrison |
| Area | |
| • Total | 2,067 sq mi (5,354 km2) |
| • Land | 2,067 sq mi (5,354 km2) |
| • Water | 0.7 sq mi (2 km2), 0.03% |
| Population | |
| • (2010) | 1,311 |
| • Density | 0.6/sq mi (0/km²) |
| Congressional district | 3rd |
| Time zone | Mountain: UTC-7/-6 |
Sioux County is a county in the U.S. state of Nebraska. As of the 2010 census, the population was 1,311.[1] Its county seat is Harrison.[2]
Sioux County is included in the Scottsbluff, NE Micropolitan Statistical Area.
In the Nebraska license plate system, Sioux County is represented by the prefix 80 (it had the 80th-largest number of vehicles registered in the state when the license plate system was established in 1922).
Geography
According to the U.S. Census Bureau, the county has an area of 2,067 square miles (5,350 km2), of which 2,067 square miles (5,350 km2) is land and 0.7 square miles (1.8 km2) (0.03%) is water.[3]
Major highways
Adjacent counties
- Fall River County, South Dakota - north
- Box Butte County - east
- Dawes County - east
- Scotts Bluff County - south
- Goshen County, Wyoming - southwest
- Niobrara County, Wyoming - northwest
National protected areas
- Agate Fossil Beds National Monument
- Nebraska National Forest (part)
- Oglala National Grassland (part)
Demographics
| Historical population | |||
|---|---|---|---|
| Census | Pop. | %± | |
| 1880 | 699 | — | |
| 1890 | 2,452 | 250.8% | |
| 1900 | 2,055 | −16.2% | |
| 1910 | 5,599 | 172.5% | |
| 1920 | 4,528 | −19.1% | |
| 1930 | 4,667 | 3.1% | |
| 1940 | 4,001 | −14.3% | |
| 1950 | 3,124 | −21.9% | |
| 1960 | 2,575 | −17.6% | |
| 1970 | 2,034 | −21.0% | |
| 1980 | 1,845 | −9.3% | |
| 1990 | 1,549 | −16.0% | |
| 2000 | 1,475 | −4.8% | |
| 2010 | 1,311 | −11.1% | |
| Est. 2016 | 1,242 | [4] | −5.3% |
| U.S. Decennial Census[5] 1790-1960[6] 1900-1990[7] 1990-2000[8] 2010-2013[1] | |||
As of the census[9] of 2000, there were 1,475 people, 605 households, and 444 families residing in the county. The population density was 1 people per square mile (0/km²). There were 780 housing units at an average density of 0 per square mile (0/km²). The racial makeup of the county was 97.63% White, 0.14% Native American, 0.20% Asian, 1.15% from other races, and 0.88% from two or more races. 2.31% of the population were Hispanic or Latino of any race. 36.9% were of German, 11.3% Irish, 11.0% American and 10.6% English ancestry according to Census 2000.
There were 605 households out of which 28.10% had children under the age of 18 living with them, 65.30% were married couples living together, 5.10% had a female householder with no husband present, and 26.60% were non-families. 23.60% of all households were made up of individuals and 9.40% had someone living alone who was 65 years of age or older. The average household size was 2.44 and the average family size was 2.86.
In the county, the population was spread out with 24.30% under the age of 18, 7.20% from 18 to 24, 24.70% from 25 to 44, 27.50% from 45 to 64, and 16.20% who were 65 years of age or older. The median age was 42 years. For every 100 females there were 111.00 males. For every 100 females age 18 and over, there were 102.20 males.
The median income for a household in the county was $29,851, and the median income for a family was $31,406. Males had a median income of $23,409 versus $21,490 for females. The per capita income for the county was $15,999. About 11.10% of families and 15.40% of the population were below the poverty line, including 24.40% of those under age 18 and 7.50% of those age 65 or over.
Politics
| Year | Republican | Democratic | Third Parties |
|---|---|---|---|
| 2016 | 83.7% 616 | 11.0% 81 | 5.3% 39 |
| 2012 | 84.4% 624 | 13.7% 101 | 1.9% 14 |
| 2008 | 82.4% 603 | 16.0% 117 | 1.6% 12 |
| 2004 | 83.7% 677 | 15.2% 123 | 1.1% 9 |
| 2000 | 83.6% 629 | 13.0% 98 | 3.3% 25 |
| 1996 | 71.7% 551 | 18.0% 138 | 10.3% 79 |
| 1992 | 55.5% 445 | 18.5% 148 | 26.1% 209 |
| 1988 | 74.1% 568 | 25.3% 194 | 0.7% 5 |
| 1984 | 85.1% 732 | 14.1% 121 | 0.8% 7 |
| 1980 | 81.6% 760 | 12.9% 120 | 5.6% 52 |
| 1976 | 60.3% 532 | 37.3% 329 | 2.5% 22 |
| 1972 | 83.2% 639 | 16.8% 129 | |
| 1968 | 71.4% 565 | 19.9% 157 | 8.7% 69 |
| 1964 | 64.8% 698 | 35.2% 379 | |
| 1960 | 64.2% 745 | 35.8% 415 | |
| 1956 | 65.7% 499 | 34.3% 260 | |
| 1952 | 78.5% 1,093 | 21.5% 300 | |
| 1948 | 55.8% 657 | 44.2% 520 | |
| 1944 | 68.2% 876 | 31.8% 408 | |
| 1940 | 63.4% 1,072 | 36.6% 618 | |
| 1936 | 40.7% 674 | 57.7% 956 | 1.7% 28 |
| 1932 | 39.1% 667 | 59.0% 1,006 | 1.8% 31 |
| 1928 | 72.5% 1,178 | 26.8% 435 | 0.7% 11 |
| 1924 | 36.0% 480 | 11.2% 149 | 52.8% 704 |
| 1920 | 65.0% 627 | 26.1% 252 | 8.9% 86 |
| 1916 | 30.5% 344 | 65.3% 737 | 4.2% 47 |
| 1912 | 15.1% 150 | 37.8% 375 | 47.0% 466 |
| 1908 | 50.8% 516 | 45.7% 464 | 3.5% 35 |
| 1904 | 62.1% 247 | 27.9% 111 | 10.1% 40 |
| 1900 | 44.4% 199 | 55.4% 248 | 0.2% 1 |
Sioux County, like almost all counties in western Nebraska, is heavily Republican, giving John McCain(R) 82.38% of its vote, compared to 15.98% for Barack Obama in the 2008 US presidential election.[11]
Sioux County is in Nebraska's 3rd congressional district which has been represented by Adrian Smith(R) since 2006.
Attractions
- Agate Fossil Beds National Monument
- Oglala National Grassland
- Toadstool Geologic Park
- Hudson-Meng Bison Kill
Communities
See also
References
- 1 2 "State & County QuickFacts". United States Census Bureau. Retrieved September 22, 2013.
- ↑ "Find a County". National Association of Counties. Retrieved 2011-06-07.
- ↑ "2010 Census Gazetteer Files". United States Census Bureau. August 22, 2012. Retrieved December 11, 2014.
- ↑ "Population and Housing Unit Estimates". Retrieved June 9, 2017.
- ↑ "U.S. Decennial Census". United States Census Bureau. Retrieved December 11, 2014.
- ↑ "Historical Census Browser". University of Virginia Library. Retrieved December 11, 2014.
- ↑ "Population of Counties by Decennial Census: 1900 to 1990". United States Census Bureau. Retrieved December 11, 2014.
- ↑ "Census 2000 PHC-T-4. Ranking Tables for Counties: 1990 and 2000" (PDF). United States Census Bureau. Retrieved December 11, 2014.
- ↑ "American FactFinder". United States Census Bureau. Retrieved 2008-01-31.
- ↑ http://uselectionatlas.org/RESULTS
- ↑ "Dave Leip's Atlas of U.S. Presidential Elections". Retrieved 2011-06-11.
External links
Places adjacent to Sioux County, Nebraska | |||||||||||||||||
|---|---|---|---|---|---|---|---|---|---|---|---|---|---|---|---|---|---|
 |
| | |||||||||||||||
Municipalities and communities of Sioux County, Nebraska, United States | ||
|---|---|---|
| Village | ||
| Unincorporated communities | ||
Coordinates: 42°29′N 103°46′W / 42.48°N 103.77°W