San Francisco Board of Supervisors election, 2006
The 2006 San Francisco Board of Supervisors elections occurred on November 7, 2006. Five of the eleven seats were contested in this election. Four of the five incumbents ran for reelection, while one sought another elected office.
Municipal elections in California are officially non-partisan, though most candidates in San Francisco do receive funding and support from various political parties.
Results
District 2
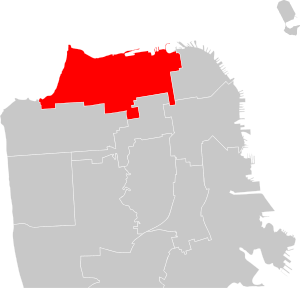
District 2 consists of the Marina, Pacific Heights, the Presidio, part of Russian Hill, and Sea Cliff. Incumbent supervisor Michela Alioto-Pier ran for reelection.
District 2 supervisorial election, 2006[1][2]
| Candidate |
Votes |
Percentage |
| Michela Alioto-Pier (incumbent) |
16,393 |
80.13% |
| Vilma Guinto Peoro |
3,353 |
16.39% |
| Dave Kiddoo (write-in) |
712 |
3.48% |
| Valid votes |
20,458 |
76.18% |
| Invalid or blank votes |
6,396 |
23.81% |
| Total votes |
26,854 |
100.00% |
| Voter turnout |
62.72% |
District 4
District 4 consists primarily of the Sunset district. Incumbent supervisor Fiona Ma did not run for reelection.
District 4 supervisorial election, 2006[1][3]
| Candidate |
Votes |
Percentage |
| Ed Jew |
5,125 |
26.23% |
| Ron Dudum |
5,072 |
25.96% |
| Jaynry Mak |
4,504 |
23.05% |
| Doug Chan |
3,192 |
16.34% |
| David Ferguson |
1,419 |
7.26% |
| Houston Zheng |
225 |
1.15% |
| Valid votes |
19,539 |
87.68% |
| Invalid or blank votes |
2,746 |
12.32% |
| Total votes |
22,285 |
100.00% |
| Voter turnout |
60.79% |
| Ranked choice voting — Pass 4
|
| Ed Jew |
8,388 |
52.51% |
| Ron Dudum |
7,587 |
47.49% |
| Eligible votes |
15,975 |
72.66% |
| Exhausted votes |
6,010 |
27.34% |
| Total votes |
21,985 |
100.00% |
Ranked-choice vote distribution
| Candidate | Pass 1 | Pass 2 | Pass 3 | Pass 4 |
| Ed Jew | 5,184 | 5,441 | 6,455 | 8,388 |
| Ron Dudum | 5,134 | 5,521 | 6,305 | 7,587 |
| Jaynry Mak | 4,569 | 5,012 | 5,851 | |
| Doug Chan | 3,236 | 3,414 | |
| David Ferguson | 1,455 | |
| Houston Zheng | 234 |
| Eligible ballots | 19,814 | 19,388 | 18,611 | 15,975 |
| Exhausted ballots | 2,171 | 2,597 | 3,374 | 6,010 |
| Total | 21,985 | 21,985 | 21,985 | 21,985 |
District 6
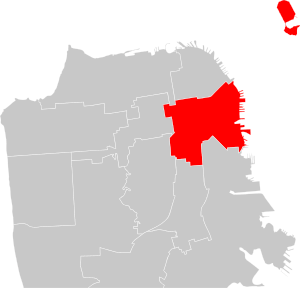
District 6 consists of Alcatraz Island, Civic Center, Mission Bay, South of Market, the Tenderloin, Treasure Island, and Yerba Buena Island. Incumbent supervisor Chris Daly ran for reelection.
District 6 supervisorial election, 2006[1][4]
| Candidate |
Votes |
Percentage |
| Chris Daly (incumbent) |
8,654 |
48.82% |
| Rob Black |
7,051 |
39.77% |
| Matt Drake |
669 |
3.77% |
| Davy Jones |
372 |
2.10% |
| Viliam Dugovic |
330 |
1.86% |
| Manuel Jimenez, Jr. |
311 |
1.75% |
| George Dias |
222 |
1.25% |
| Robert Jordan |
119 |
0.67% |
| Valid votes |
17,728 |
89.02% |
| Invalid or blank votes |
2,187 |
10.98% |
| Total votes |
19,915 |
100.00% |
| Voter turnout |
55.94% |
| Ranked choice voting — Pass 5
|
| Chris Daly (incumbent) |
8,968 |
50.82% |
| Rob Black |
7,303 |
41.39% |
| Matt Drake |
869 |
4.92% |
| Davy Jones |
506 |
2.87% |
| Eligible votes |
17,646 |
88.61% |
| Exhausted votes |
2,269 |
11.39% |
| Total votes |
19,915 |
100.00% |
Ranked-choice vote distribution
| Candidate | Pass 1 | Pass 2 | Pass 3 | Pass 4 | Pass 5 |
| Chris Daly | 8,746 | 8,763 | 8,803 | 8,871 | 8,968 |
| Rob Black | 7,115 | 7,115 | 7,173 | 7,215 | 7,303 |
| Matt Drake | 679 | 688 | 725 | 830 | 869 |
| Davy Jones | 389 | 402 | 421 | 463 | 506 |
| Manuel Jimenez, Jr. | 317 | 328 | 375 | 399 | |
| Viliam Dugovic | 340 | 348 | 358 | |
| George Dias | 230 | 231 | |
| Robert Jordan | 125 | |
| Eligible ballots | 17,941 | 17,894 | 17,855 | 17,778 | 17,646 |
| Exhausted ballots | 1,974 | 2,021 | 2,060 | 2,137 | 2,269 |
| Total | 19,915 | 19,915 | 19,915 | 19,915 | 19,915 |
District 8
District 8 consists of The Castro, Diamond Heights, Duboce Triangle, Eureka Valley, Glen Park, and Noe Valley. Incumbent supervisor Bevan Dufty ran for reelection.
District 8 supervisorial election, 2006[1]
| Candidate |
Votes |
Percentage |
| Bevan Dufty (incumbent) |
20,761 |
66.24% |
| Alex Rosenthal |
9,109 |
29.07% |
| Starchild |
1,470 |
4.69% |
| Valid votes |
31,340 |
87.84% |
| Invalid or blank votes |
4,340 |
12.16% |
| Total votes |
35,680 |
100.00% |
| Voter turnout |
70.9% |
District 10
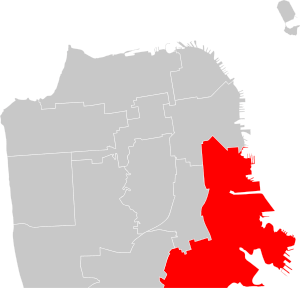
District 10 consists of Bayview-Hunters Point, McLaren Park, part of the Portola, Potrero Hill, and Visitacion Valley. Incumbent supervisor Sophie Maxwell ran for reelection.
District 10 supervisorial election, 2006[1]
| Candidate |
Votes |
Percentage |
| Sophie Maxwell (incumbent) |
7,916 |
56.17% |
| Dwayne Jusino |
1,684 |
11.95% |
| Espanola Jackson |
1,437 |
10.20% |
| Rodney Hampton, Jr. |
1,185 |
8.41% |
| Marie L. Harrison |
1,129 |
8.01% |
| Charlie Walker |
473 |
3.36% |
| Sala Chandler |
270 |
1.92% |
| Valid votes |
14,094 |
83.20% |
| Invalid or blank votes |
2,846 |
16.80% |
| Total votes |
16,940 |
100.00% |
| Voter turnout |
49.77% |
References
External links
California elections, 2006 |
|---|
| June primary election | |
|---|
| November general election |
- Senate
- House of Representatives
- Governor
- Lieutenant Governor
- Secretary of State
- State Controller
- State Treasurer
- Attorney General
- Insurance Commissioner
- Courts of Appeal
- State Senate
- State Assembly
- Propositions: 1A, 1B, 1C, 1D, 1E, 83, 84, 85, 86, 87, 88, 89, and 90
|
|---|
| Special elections | |
|---|


