Results breakdown of the Spanish general election, 2015 (Congress)
 |
Main: Spanish general election, 2015 |
|---|
| 20 December 2015 |
| |
| |
| Party | Votes | % | MPs |
| | PP | 7,236,965 | 28.7% | 123 |
| | PSOE | 5,545,315 | 22.0% | 90 |
| | Podemos | 5,212,711 | 20.7% | 69 |
| | C's | 3,514,528 | 13.9% | 40 |
| | IU–UPeC | 926,783 | 3.7% | 2 |
| | ERC–CatSí | 604,285 | 2.4% | 9 |
| | DiL | 567,253 | 2.2% | 8 |
| | EAJ/PNV | 302,316 | 1.2% | 6 |
| | EH Bildu | 219,125 | 0.9% | 2 |
| | Others | 1,082,032 | 4.3% | 1 |
| Total | 25,211,313 | 100.0% | 350 |
This is the results breakdown of the Congress of Deputies election held in Spain on 20 December 2015. The following tables show detailed results in each of the country's 17 autonomous communities and in the autonomous cities of Ceuta and Melilla, as well as a summary of constituency results.[1]
Electoral system
348 members of the Congress of Deputies were elected using the D'Hondt method and a closed list proportional representation, with a threshold of 3 per 100 of valid votes—which included blank ballots—being applied in each constituency. Parties not reaching the threshold were not taken into consideration for seat distribution. Additionally, the use of the D'Hondt method might result in an effective threshold over three percent, dependant on the district magnitude.[2] Seats were allocated to constituencies, corresponding to the provinces of Spain. Each constituency was entitled to an initial minimum of two seats, with the remaining 248 allocated among the constituencies in proportion to their populations. Ceuta and Melilla were allocated the two remaining seats, which were elected using plurality voting. Voting was on the basis of universal suffrage, with all nationals over eighteen and in full enjoyment of all political rights entitled to vote. Additionally, Spaniards abroad were required to apply for voting before being permitted to vote, a system known as "begged" or expat vote (Spanish: Voto rogado).[3]
The electoral law provided that parties, federations, coalitions and groupings of electors were allowed to present lists of candidates. However, parties, federations or coalitions who had not obtained a mandate in either House of Parliament at the preceding election were required to secure at least the signature of 0.1 per 100 of the electors entered in electoral register of the constituency for which they were seeking election, whereas groupings of electors were required to secure the signature of 1 per 100 of electors. Electors were barred from signing for more than one list of candidates. Concurrently, parties and federations intending to enter in coalition to take part jointly at an election were required to inform the relevant Electoral Commission within ten days from the election call.[4][5][6][7]
Nationwide
|
Democracy and Freedom (DiL)10 |
567,253 | 2.25 | –1.92 |
8 | –8 |
|
Basque Nationalist Party (EAJ/PNV) |
302,316 | 1.20 | –0.13 |
6 | +1 |
|
Animalist Party Against Mistreatment of Animals (PACMA) |
220,369 | 0.87 | +0.45 |
0 | ±0 |
|
Basque Country Unite (EH Bildu)11 |
219,125 | 0.87 | –0.50 |
2 | –5 |
|
Union, Progress and Democracy (UPyD) |
155,153 | 0.62 | –4.08 |
0 | –5 |
|
Canarian Coalition–Canarian Nationalist Party (CCa–PNC) |
81,917 | 0.32 | –0.27 |
1 | –1 |
|
We–Galician Candidacy (Nós)12 |
70,863 | 0.28 | –0.48 |
0 | –2 |
|
Democratic Union of Catalonia (unio.cat) |
65,388 | 0.26 | New |
0 | ±0 |
|
Vox (Vox) |
58,114 | 0.23 | New |
0 | ±0 |
|
Zero Cuts–Green Group (Recortes Cero–GV) |
48,675 | 0.19 | New |
0 | ±0 |
|
More (Més)13 |
33,877 | 0.13 | ±0.00 |
0 | ±0 |
|
Communist Party of the Peoples of Spain (PCPE) |
31,179 | 0.12 | +0.01 |
0 | ±0 |
|
Yes to the Future (GBai)14 |
30,642 | 0.12 | –0.05 |
0 | –1 |
| Parties with less than 0.1% of the vote |
97,723 |
0.39 |
— |
0 |
±0 |
|
Proposal for the Isles (El PI) |
12,910 | 0.05 | New |
0 | ±0 |
|
Citizens of Democratic Centre (CCD) |
10,827 | 0.04 | +0.04 |
0 | ±0 |
|
Blank Seats (EB) |
10,084 | 0.04 | –0.36 |
0 | ±0 |
|
Spanish Falange of the JONS (FE–JONS) |
7,495 | 0.03 | +0.02 |
0 | ±0 |
|
For the Left–The Greens (X Izda) |
7,314 | 0.03 | New |
0 | ±0 |
|
We Are Valencian (SOMVAL) |
6,103 | 0.02 | New |
0 | ±0 |
|
For a Fairer World (PUM+J) |
4,586 | 0.02 | –0.09 |
0 | ±0 |
|
Internationalist Solidarity and Self-Management (SAIn) |
4,400 | 0.02 | –0.01 |
0 | ±0 |
|
The Eco-pacifist Greens (Centro Moderado) |
3,278 | 0.01 | New |
0 | ±0 |
|
Land Party (PT) |
3,026 | 0.01 | New |
0 | ±0 |
|
Canaries Decides (LV–UP–ALTER)15 |
2,883 | 0.01 | +0.01 |
0 | ±0 |
|
Libertarian Party (P–LIB) |
2,854 | 0.01 | ±0.00 |
0 | ±0 |
|
Humanist Party (PH) |
2,846 | 0.01 | –0.03 |
0 | ±0 |
|
United Extremadura–Extremadurans (EU–eX) |
2,021 | 0.01 | New |
0 | ±0 |
|
Spanish Communist Workers' Party (PCOE) |
1,909 | 0.01 | New |
0 | ±0 |
|
National Democracy (DN) |
1,704 | 0.01 | ±0.00 |
0 | ±0 |
|
Feminist Initiative (IFem) |
1,604 | 0.01 | New |
0 | ±0 |
|
Regionalist Party of the Leonese Country (PREPAL) |
1,419 | 0.01 | ±0.00 |
0 | ±0 |
|
In Positive (En Positiu) |
1,276 | 0.01 | New |
0 | ±0 |
|
United Free Citizens (CILUS) |
1,189 | 0.00 | New |
0 | ±0 |
|
Grouped Rural Citizens (CRA) |
1,032 | 0.00 | New |
0 | ±0 |
|
Navarrese Freedom (Ln) |
1,026 | 0.00 | New |
0 | ±0 |
|
Forward Valencians (Avant) |
1,003 | 0.00 | New |
0 | ±0 |
|
Málaga for Yes (mlgXSÍ) |
934 | 0.00 | New |
0 | ±0 |
|
Family and Life Party (PFyV) |
714 | 0.00 | ±0.00 |
0 | ±0 |
|
Andalusians of Jaén United (AJU) |
711 | 0.00 | New |
0 | ±0 |
|
Independents for Aragon (i) |
676 | 0.00 | New |
0 | ±0 |
|
Democratic Forum (FDEE) |
456 | 0.00 | New |
0 | ±0 |
|
To Solution (Soluciona) |
409 | 0.00 | New |
0 | ±0 |
|
Social Justice, Citizen Participation (JS,PC) |
406 | 0.00 | New |
0 | ±0 |
|
Death to the System (+MAS+) |
313 | 0.00 | ±0.00 |
0 | ±0 |
|
Liberal Party of the Right (PLD) |
205 | 0.00 | New |
0 | ±0 |
|
Welcome (Ongi Etorri) |
110 | 0.00 | New |
0 | ±0 |
|
Blank ballots |
188,132 | 0.75 | –0.62 |
|
|
| Total |
25,211,313 | 100.00 | |
350 | ±0 |
|
| Valid votes |
25,211,313 | 99.11 | +0.40 |
|
| Invalid votes |
227,219 | 0.89 | –0.40 |
| Votes cast / turnout |
25,438,532 | 69.67 | +0.73 |
| Abstentions |
11,073,316 | 30.33 | –0.73 |
| Registered voters |
36,511,848 | |
|
| Source(s): Ministry of the Interior, historiaelectoral.com |
| Notes: |
|
1 People's Party results are compared to the combined totals of the People's Party and Asturias Forum in the 2011 election.
2 Aggregated data for Podemos, En Comú Podem, És el moment and En Marea. While nominally different alliances, they did not compete against each other in the same geographical regions, supported Pablo Iglesias as joint candidate for Prime Minister and formed one group within Congress, except for Compromís MPs.
3 Podemos does not include results in Catalonia, Valencian Community and Galicia.
4 En Comú Podem results are compared to Initiative for Catalonia Greens–United and Alternative Left totals in the 2011 election.
5 És el moment results are compared to Commitment Coalition–Equo totals in the 2011 election.
6 En Marea results are compared to United Left of Galicia totals in the 2011 election.
7 United Left–Popular Unity in Common results are compared to United Left–The Greens: Plural Left totals in the 2011 election. It does not include results in Catalonia and Galicia.
8 Aggregated data for Republican Left of Catalonia–Catalonia Yes and Now, Valencian Country. While nominally different alliances, they did not compete against each other in the same geographical regions.
9 Now, Valencian Country results are compared to Republican Left of the Valencian Country totals in the 2011 election.
10 Democracy and Freedom results are compared to Convergence and Union totals in the 2011 election.
11 Basque Country Unite results are compared to Amaiur totals in the 2011 election.
12 We–Galician Candidacy results are compared to Galician Nationalist Bloc totals in the 2011 election.
13 Més results are compared to PSM–Initiative Greens–Agreement–Equo totals in the 2011 election.
14 Yes to the Future was supported by the Basque Nationalist Party in Navarre, but it acted on its own and was an independent alliance.
15 Canaries Decides results are compared to Unity of the People totals in the 2011 election. |
|
Constituencies
Summary of constituency results in the 20 December 2015 Congress of Deputies election
| Constituency |
PP |
PSOE |
Podemos |
C's |
IU–UPeC |
ERC |
DiL |
PNV |
EH Bildu |
CCa–PNC |
|
|
|
|
|
|
|
|
|
|
| % |
S |
% |
S |
% |
S |
% |
S |
% |
S |
% |
S |
% |
S |
% |
S |
% |
S |
% |
S |
| A Coruña |
35.5 |
3 |
20.4 |
2 |
26.3 |
2 |
9.9 |
1 |
|
|
|
|
|
|
| Álava |
18.8 |
1 |
14.1 |
1 |
27.0 |
1 |
5.9 |
− |
3.8 |
− |
15.8 |
1 |
11.8 |
− |
| Albacete |
36.8 |
2 |
28.2 |
1 |
14.0 |
− |
14.6 |
1 |
4.0 |
− |
|
|
| Alicante |
32.8 |
4 |
20.8 |
3 |
22.3 |
3 |
17.1 |
2 |
3.7 |
− |
0.1 |
− |
| Almería |
38.0 |
2 |
28.9 |
2 |
12.8 |
1 |
14.4 |
1 |
3.5 |
− |
|
| Asturias |
30.1 |
3 |
23.3 |
2 |
21.3 |
2 |
13.6 |
1 |
8.4 |
− |
| Ávila |
46.1 |
2 |
19.9 |
1 |
11.7 |
− |
15.7 |
− |
3.8 |
− |
| Badajoz |
34.5 |
2 |
37.2 |
3 |
11.9 |
1 |
11.4 |
− |
3.1 |
− |
| Balearic Islands |
29.1 |
3 |
18.3 |
2 |
23.1 |
2 |
14.8 |
1 |
2.4 |
− |
| Barcelona |
11.3 |
4 |
16.3 |
5 |
26.9 |
9 |
13.5 |
4 |
|
14.5 |
5 |
13.2 |
4 |
| Biscay |
11.4 |
1 |
13.0 |
1 |
26.1 |
2 |
3.8 |
− |
2.8 |
− |
|
|
27.9 |
3 |
12.5 |
1 |
| Burgos |
38.0 |
2 |
20.7 |
1 |
17.1 |
1 |
15.6 |
− |
4.7 |
− |
|
|
| Cáceres |
35.3 |
2 |
34.0 |
2 |
13.9 |
− |
11.4 |
− |
2.9 |
− |
| Cádiz |
27.7 |
3 |
28.0 |
3 |
20.2 |
2 |
14.7 |
1 |
6.0 |
− |
| Cantabria |
36.9 |
2 |
22.4 |
1 |
17.9 |
1 |
15.2 |
1 |
4.4 |
− |
| Castellón |
31.8 |
2 |
21.5 |
1 |
24.1 |
1 |
15.6 |
1 |
3.1 |
− |
0.1 |
− |
| Ceuta |
44.9 |
1 |
23.1 |
− |
14.1 |
− |
13.3 |
− |
1.3 |
− |
|
| Ciudad Real |
38.4 |
3 |
31.1 |
2 |
12.5 |
− |
12.3 |
− |
3.3 |
− |
| Córdoba |
30.4 |
2 |
32.0 |
2 |
14.7 |
1 |
11.9 |
1 |
8.1 |
− |
| Cuenca |
41.9 |
2 |
30.6 |
1 |
11.7 |
− |
10.8 |
− |
3.0 |
− |
| Gipuzkoa |
8.7 |
− |
13.3 |
1 |
25.3 |
2 |
3.8 |
− |
2.8 |
− |
23.5 |
2 |
20.9 |
1 |
| Girona |
8.5 |
− |
12.7 |
1 |
16.3 |
1 |
9.8 |
− |
|
23.5 |
2 |
25.0 |
2 |
|
|
| Granada |
31.1 |
3 |
31.0 |
2 |
16.4 |
1 |
13.9 |
1 |
5.1 |
− |
|
|
| Guadalajara |
34.8 |
1 |
22.5 |
1 |
17.5 |
− |
18.1 |
1 |
4.1 |
− |
| Huelva |
28.7 |
2 |
36.9 |
2 |
15.2 |
1 |
11.9 |
− |
4.5 |
− |
| Huesca |
32.5 |
1 |
24.7 |
1 |
18.0 |
1 |
16.2 |
− |
5.3 |
− |
| Jaén |
31.5 |
2 |
38.3 |
3 |
12.6 |
− |
10.7 |
− |
4.3 |
− |
| La Rioja |
38.3 |
2 |
23.7 |
1 |
15.8 |
1 |
15.1 |
− |
4.2 |
− |
| Las Palmas |
28.2 |
3 |
22.4 |
2 |
26.5 |
2 |
12.3 |
1 |
3.0 |
− |
4.2 |
− |
| León |
35.6 |
2 |
25.4 |
1 |
17.6 |
1 |
13.0 |
1 |
4.8 |
− |
|
| Lleida |
11.3 |
− |
12.4 |
1 |
15.4 |
1 |
9.0 |
− |
|
22.3 |
1 |
24.3 |
1 |
| Lugo |
42.5 |
2 |
24.0 |
1 |
19.2 |
1 |
7.6 |
− |
|
|
|
| Madrid |
33.4 |
13 |
17.8 |
6 |
20.9 |
8 |
18.8 |
7 |
5.3 |
2 |
| Málaga |
28.9 |
4 |
26.9 |
3 |
17.1 |
2 |
17.1 |
2 |
6.8 |
− |
| Melilla |
43.9 |
1 |
24.6 |
− |
11.4 |
− |
15.5 |
− |
1.3 |
− |
| Murcia |
40.4 |
5 |
20.3 |
2 |
15.2 |
1 |
17.7 |
2 |
3.1 |
− |
| Navarre |
28.9 |
2 |
15.5 |
1 |
23.0 |
2 |
7.1 |
− |
4.1 |
− |
9.9 |
− |
| Ourense |
44.9 |
2 |
23.2 |
1 |
17.8 |
1 |
7.9 |
− |
|
|
| Palencia |
40.3 |
2 |
24.5 |
1 |
13.5 |
− |
14.2 |
− |
4.5 |
− |
| Pontevedra |
34.5 |
3 |
20.8 |
2 |
27.9 |
2 |
9.0 |
− |
|
| Salamanca |
42.7 |
2 |
21.8 |
1 |
12.3 |
− |
16.8 |
1 |
3.3 |
− |
| Santa Cruz de Tenerife |
28.9 |
2 |
21.5 |
2 |
19.9 |
1 |
10.5 |
1 |
3.3 |
− |
12.6 |
1 |
| Segovia |
39.4 |
2 |
21.5 |
1 |
14.3 |
− |
17.1 |
− |
4.1 |
− |
|
| Seville |
25.2 |
3 |
33.9 |
5 |
19.0 |
2 |
13.0 |
2 |
5.7 |
− |
| Soria |
38.6 |
1 |
23.8 |
1 |
16.1 |
− |
15.2 |
− |
3.5 |
− |
| Tarragona |
12.2 |
1 |
15.8 |
1 |
20.6 |
1 |
14.2 |
1 |
|
17.5 |
1 |
15.3 |
1 |
| Teruel |
36.4 |
2 |
25.7 |
1 |
15.3 |
− |
14.7 |
− |
5.0 |
− |
|
|
| Toledo |
38.8 |
2 |
27.8 |
2 |
13.6 |
1 |
13.8 |
1 |
3.5 |
− |
| Valencia |
30.2 |
5 |
18.8 |
3 |
27.1 |
5 |
15.1 |
2 |
4.7 |
− |
0.1 |
− |
| Valladolid |
36.9 |
2 |
21.6 |
1 |
15.3 |
1 |
17.1 |
1 |
5.5 |
− |
|
| Zamora |
42.6 |
2 |
23.0 |
1 |
14.0 |
− |
12.9 |
− |
4.9 |
− |
| Zaragoza |
30.3 |
3 |
22.3 |
2 |
19.2 |
1 |
17.8 |
1 |
6.5 |
− |
|
| Total |
28.7 |
123 |
22.0 |
90 |
20.7 |
69 |
13.9 |
40 |
3.7 |
2 |
2.4 |
9 |
2.2 |
8 |
1.2 |
6 |
0.9 |
2 |
0.3 |
1 |
Regions
Summary
Autonomous communities
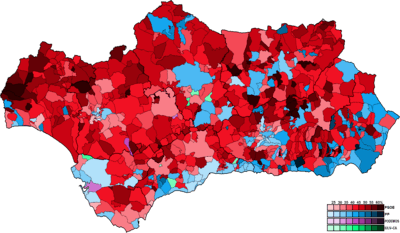
Andalusia
| Parties with less than 1.0% of the vote |
94,255 |
2.12 |
— |
0 |
±0 |
|
Animalist Party Against Mistreatment of Animals (PACMA) |
40,879 | 0.92 | +0.74 |
0 | ±0 |
|
Union, Progress and Democracy (UPyD) |
23,179 | 0.52 | –4.25 |
0 | ±0 |
|
Vox (Vox) |
9,005 | 0.20 | New |
0 | ±0 |
|
Zero Cuts–Green Group (Recortes Cero–GV) |
5,676 | 0.13 | New |
0 | ±0 |
|
Communist Party of the Peoples of Spain (PCPE) |
5,368 | 0.12 | –0.01 |
0 | ±0 |
|
Spanish Communist Workers' Party (PCOE) |
1,909 | 0.04 | New |
0 | ±0 |
|
Spanish Falange of the JONS (FE–JONS) |
1,826 | 0.04 | ±0.00 |
0 | ±0 |
|
Libertarian Party (P–LIB) |
1,364 | 0.03 | New |
0 | ±0 |
|
United Free Citizens (CILUS) |
1,189 | 0.03 | New |
0 | ±0 |
|
Málaga for Yes (mlgXSÍ) |
934 | 0.02 | New |
0 | ±0 |
|
Andalusians of Jaén United (AJU) |
711 | 0.02 | New |
0 | ±0 |
|
Blank Seats (EB) |
631 | 0.01 | –0.25 |
0 | ±0 |
|
For a Fairer World (PUM+J) |
621 | 0.01 | –0.06 |
0 | ±0 |
|
To Solution (Soluciona) |
409 | 0.01 | New |
0 | ±0 |
|
National Democracy (DN) |
356 | 0.01 | –0.01 |
0 | ±0 |
|
Internationalist Solidarity and Self-Management (SAIn) |
198 | 0.00 | –0.04 |
0 | ±0 |
|
Blank ballots |
37,729 | 0.85 | –0.37 |
|
|
| Total |
4,451,503 | 100.00 | |
61 | +1 |
|
| Valid votes |
4,451,503 | 99.06 | +0.09 |
|
| Invalid votes |
42,319 | 0.94 | –0.09 |
| Votes cast / turnout |
4,493,822 | 69.08 | +0.18 |
| Abstentions |
2,011,444 | 30.92 | –0.18 |
| Registered voters |
6,505,266 | |
|
| Source: Ministry of the Interior |
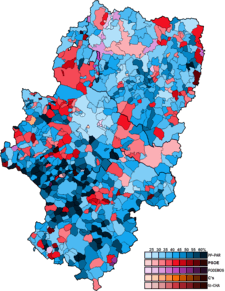
Aragon
|
Blank ballots |
6,791 | 0.93 | –1.11 |
|
|
| Total |
733,579 | 100.00 | |
13 | ±0 |
|
| Valid votes |
733,579 | 99.17 | +0.74 |
|
| Invalid votes |
6,128 | 0.83 | –0.74 |
| Votes cast / turnout |
739,707 | 72.58 | +1.59 |
| Abstentions |
279,428 | 27.42 | –1.59 |
| Registered voters |
1,019,135 | |
|
| Source: Ministry of the Interior |
Asturias
|
Blank ballots |
5,591 | 0.90 | –0.43 |
|
|
| Total |
622,967 | 100.00 | |
8 | ±0 |
|
| Valid votes |
622,967 | 99.17 | +0.14 |
|
| Invalid votes |
5,233 | 0.83 | –0.14 |
| Votes cast / turnout |
628,200 | 63.77 | –0.80 |
| Abstentions |
356,887 | 36.23 | +0.80 |
| Registered voters |
985,087 | |
|
| Source: Ministry of the Interior |
|
|
Balearic Islands
|
Blank ballots |
3,997 | 0.83 | –0.98 |
|
|
| Total |
483,970 | 100.00 | |
8 | ±0 |
|
| Valid votes |
483,970 | 99.04 | +0.66 |
|
| Invalid votes |
4,696 | 0.96 | –0.66 |
| Votes cast / turnout |
488,666 | 63.35 | +2.39 |
| Abstentions |
282,715 | 36.65 | –2.39 |
| Registered voters |
771,381 | |
|
| Source: Ministry of the Interior |
|
|
Basque Country
|
Blank ballots |
8,669 | 0.71 | –0.43 |
|
|
| Total |
1,222,757 | 100.00 | |
18 | ±0 |
|
| Valid votes |
1,222,757 | 99.31 | +0.35 |
|
| Invalid votes |
8,441 | 0.69 | –0.35 |
| Votes cast / turnout |
1,231,198 | 69.00 | +1.66 |
| Abstentions |
553,031 | 31.00 | –1.66 |
| Registered voters |
1,784,229 | |
|
| Source: Ministry of the Interior |
|
|
Canary Islands
|
Blank ballots |
7,262 | 0.73 | –0.57 |
|
|
| Total |
994,031 | 100.00 | |
15 | ±0 |
|
| Valid votes |
994,031 | 98.72 | +0.42 |
|
| Invalid votes |
12,900 | 1.28 | –0.42 |
| Votes cast / turnout |
1,006,931 | 60.33 | +0.73 |
| Abstentions |
661,980 | 39.67 | –0.73 |
| Registered voters |
1,668,911 | |
|
| Source: Ministry of the Interior |
|
|
Cantabria
|
Blank ballots |
2,849 | 0.81 | –0.37 |
|
|
| Total |
350,071 | 100.00 | |
5 | ±0 |
|
| Valid votes |
350,071 | 98.90 | +0.04 |
|
| Invalid votes |
3,904 | 1.10 | –0.04 |
| Votes cast / turnout |
353,975 | 70.97 | –0.59 |
| Abstentions |
144,796 | 29.03 | +0.59 |
| Registered voters |
498,771 | |
|
| Source: Ministry of the Interior |
Castile and León
| Parties with less than 1.0% of the vote |
37,631 |
2.49 |
— |
0 |
±0 |
|
Union, Progress and Democracy (UPyD) |
13,096 | 0.87 | –5.25 |
0 | ±0 |
|
Animalist Party Against Mistreatment of Animals (PACMA) |
8,533 | 0.57 | +0.21 |
0 | ±0 |
|
Vox (Vox) |
4,053 | 0.27 | New |
0 | ±0 |
|
Zero Cuts–Green Group (Recortes Cero–GV) |
2,526 | 0.17 | New |
0 | ±0 |
|
Communist Party of the Peoples of Spain (PCPE) |
2,232 | 0.15 | +0.09 |
0 | ±0 |
|
Citizens of Democratic Centre (CCD) |
1,579 | 0.10 | +0.07 |
0 | ±0 |
|
Regionalist Party of the Leonese Country (PREPAL) |
1,419 | 0.09 | –0.05 |
0 | ±0 |
|
Spanish Falange of the JONS (FE–JONS) |
1,090 | 0.07 | –0.01 |
0 | ±0 |
|
Grouped Rural Citizens (CRA) |
1,032 | 0.07 | New |
0 | ±0 |
|
Internationalist Solidarity and Self-Management (SAIn) |
845 | 0.06 | ±0.00 |
0 | ±0 |
|
National Democracy (DN) |
703 | 0.05 | +0.01 |
0 | ±0 |
|
Feminist Initiative (IFem) |
341 | 0.02 | New |
0 | ±0 |
|
Blank Seats (EB) |
182 | 0.01 | –0.08 |
0 | ±0 |
|
Blank ballots |
14,218 | 0.94 | –0.72 |
|
|
| Total |
1,509,936 | 100.00 | |
32 | ±0 |
|
| Valid votes |
1,509,936 | 98.90 | +0.33 |
|
| Invalid votes |
16,790 | 1.10 | –0.33 |
| Votes cast / turnout |
1,526,754 | 71.22 | –0.07 |
| Abstentions |
616,884 | 28.78 | +0.07 |
| Registered voters |
2,143,638 | |
|
| Source: Ministry of the Interior |
Castilla-La Mancha
|
Blank ballots |
8,244 | 0.70 | –0.58 |
|
|
| Total |
1,170,019 | 100.00 | |
21 | ±0 |
|
| Valid votes |
1,170,019 | 98.85 | +0.34 |
|
| Invalid votes |
13,552 | 1.15 | –0.34 |
| Votes cast / turnout |
1,183,571 | 75.26 | –0.50 |
| Abstentions |
389,033 | 24.74 | +0.50 |
| Registered voters |
1,572,604 | |
|
| Source: Ministry of the Interior |
Catalonia
|
Blank ballots |
25,440 | 0.68 | –1.17 |
|
|
| Total |
3,762,859 | 100.00 | |
47 | ±0 |
|
| Valid votes |
3,762,859 | 99.39 | +0.97 |
|
| Invalid votes |
23,065 | 0.61 | –0.97 |
| Votes cast / turnout |
3,785,924 | 68.63 | +3.47 |
| Abstentions |
1,730,532 | 31.37 | –3.47 |
| Registered voters |
5,516,456 | |
|
| Source: Ministry of the Interior |
|
|
Extremadura
|
Blank ballots |
4,676 | 0.72 | –0.45 |
|
|
| Total |
648,344 | 100.00 | |
10 | ±0 |
|
| Valid votes |
648,344 | 98.68 | +0.09 |
|
| Invalid votes |
8,651 | 1.32 | –0.09 |
| Votes cast / turnout |
656,995 | 72.17 | –1.74 |
| Abstentions |
253,289 | 27.83 | +1.74 |
| Registered voters |
910,284 | |
|
| Source: Ministry of the Interior |
Galicia
|
Blank ballots |
17,349 | 1.06 | –0.56 |
|
|
| Total |
1,642,232 | 100.00 | |
23 | ±0 |
|
| Valid votes |
1,642,232 | 98.64 | +0.26 |
|
| Invalid votes |
22,719 | 1.36 | –0.26 |
| Votes cast / turnout |
1,664,951 | 61.53 | –0.68 |
| Abstentions |
1,040,901 | 38.47 | +0.68 |
| Registered voters |
2,705,852 | |
|
| Source: Ministry of the Interior |
|
|
La Rioja
|
Blank ballots |
1,496 | 0.84 | –0.77 |
|
|
| Total |
177,207 | 100.00 | |
4 | ±0 |
|
| Valid votes |
177,207 | 98.85 | +0.43 |
|
| Invalid votes |
2,062 | 1.15 | –0.43 |
| Votes cast / turnout |
179,269 | 72.43 | –0.35 |
| Abstentions |
68,238 | 27.57 | +0.35 |
| Registered voters |
247,507 | |
|
| Source: Ministry of the Interior |
Madrid
| Parties with less than 1.0% of the vote |
73,178 |
2.02 |
— |
0 |
±0 |
|
Animalist Party Against Mistreatment of Animals (PACMA) |
28,322 | 0.78 | +0.39 |
0 | ±0 |
|
Vox (Vox) |
22,643 | 0.63 | New |
0 | ±0 |
|
For the Left–The Greens (X Izda) |
4,994 | 0.14 | New |
0 | ±0 |
|
Spanish Falange of the JONS (FE–JONS) |
4,579 | 0.13 | New |
0 | ±0 |
|
Zero Cuts–Green Group (Recortes Cero–GV) |
4,037 | 0.11 | New |
0 | ±0 |
|
For a Fairer World (PUM+J) |
2,870 | 0.08 | –0.08 |
0 | ±0 |
|
Humanist Party (PH) |
1,779 | 0.05 | –0.03 |
0 | ±0 |
|
Communist Party of the Peoples of Spain (PCPE) |
1,742 | 0.05 | –0.06 |
0 | ±0 |
|
Internationalist Solidarity and Self-Management (SAIn) |
1,137 | 0.03 | –0.01 |
0 | ±0 |
|
Libertarian Party (P–LIB) |
1,075 | 0.03 | –0.02 |
0 | ±0 |
|
Blank ballots |
18,751 | 0.52 | –0.52 |
|
|
| Total |
3,618,918 | 100.00 | |
36 | ±0 |
|
| Valid votes |
3,618,918 | 99.36 | +0.40 |
|
| Invalid votes |
23,209 | 0.64 | –0.40 |
| Votes cast / turnout |
3,642,127 | 74.12 | +0.86 |
| Abstentions |
1,271,766 | 25.88 | –0.86 |
| Registered voters |
4,913,893 | |
|
| Source: Ministry of the Interior |
Murcia
|
Blank ballots |
4,511 | 0.62 | –0.29 |
|
|
| Total |
727,615 | 100.00 | |
10 | ±0 |
|
| Valid votes |
727,615 | 99.13 | +0.06 |
|
| Invalid votes |
6,382 | 0.87 | –0.06 |
| Votes cast / turnout |
733,997 | 71.14 | –2.97 |
| Abstentions |
297,736 | 28.86 | +2.97 |
| Registered voters |
1,031,733 | |
|
| Source: Ministry of the Interior |
Navarre
|
Blank ballots |
3,714 | 1.05 | –0.98 |
|
|
| Total |
353,348 | 100.00 | |
5 | ±0 |
|
| Valid votes |
353,348 | 99.13 | +0.72 |
|
| Invalid votes |
3,114 | 0.87 | –0.72 |
| Votes cast / turnout |
356,462 | 70.93 | +2.02 |
| Abstentions |
146,058 | 29.07 | –2.02 |
| Registered voters |
502,520 | |
|
| Source: Ministry of the Interior |
| Parties with less than 1.0% of the vote |
84,962 |
3.17 |
— |
0 |
–1 |
|
Animalist Party Against Mistreatment of Animals (PACMA) |
25,008 | 0.93 | +0.45 |
0 | ±0 |
|
Union, Progress and Democracy (UPyD) |
17,303 | 0.65 | –4.95 |
0 | –1 |
|
Citizens of Democratic Centre (CCD) |
9,248 | 0.34 | New |
0 | ±0 |
|
Vox (Vox) |
7,283 | 0.27 | New |
0 | ±0 |
|
We Are Valencian (SOMVAL) |
6,103 | 0.23 | New |
0 | ±0 |
|
Zero Cuts–Green Group (Recortes Cero–GV) |
5,011 | 0.19 | New |
0 | ±0 |
|
Communist Party of the Peoples of Spain (PCPE) |
4,341 | 0.16 | –0.01 |
0 | ±0 |
|
The Eco-pacifist Greens (Centro Moderado) |
3,278 | 0.12 | New |
0 | ±0 |
|
Now, Valencian Country (Ara PV)2 |
2,503 | 0.09 | –0.20 |
0 | ±0 |
|
In Positive (En Positiu) |
1,276 | 0.05 | New |
0 | ±0 |
|
Feminist Initiative (IFem) |
1,263 | 0.05 | New |
0 | ±0 |
|
Forward Valencians (Avant) |
1,003 | 0.04 | New |
0 | ±0 |
|
National Democracy (DN) |
471 | 0.02 | New |
0 | ±0 |
|
Democratic Forum (FDEE) |
456 | 0.02 | New |
0 | ±0 |
|
Libertarian Party (P–LIB) |
415 | 0.02 | New |
0 | ±0 |
|
Blank ballots |
16,133 | 0.60 | –0.50 |
|
|
| Total |
2,680,852 | 100.00 | |
32 | –1 |
|
| Valid votes |
2,680,852 | 99.14 | +0.34 |
|
| Invalid votes |
23,170 | 0.86 | –0.34 |
| Votes cast / turnout |
2,704,022 | 74.79 | +0.61 |
| Abstentions |
911,260 | 25.21 | –0.61 |
| Registered voters |
3,615,282 | |
|
| Source: Ministry of the Interior |
|
|
Autonomous cities
Ceuta
|
Blank ballots |
413 | 1.25 | –0.32 |
|
|
| Total |
33,023 | 100.00 | |
1 | ±0 |
|
| Valid votes |
33,023 | 98.53 | +0.01 |
|
| Invalid votes |
493 | 1.47 | –0.01 |
| Votes cast / turnout |
33,516 | 54.36 | +1.20 |
| Abstentions |
28,144 | 45.64 | –1.20 |
| Registered voters |
61,660 | |
|
| Source: Ministry of the Interior |
Melilla
|
Blank ballots |
299 | 1.06 | –0.80 |
|
|
| Total |
28,082 | 100.00 | |
1 | ±0 |
|
| Valid votes |
28,082 | 98.72 | –0.14 |
|
| Invalid votes |
363 | 1.28 | +0.14 |
| Votes cast / turnout |
28,445 | 49.35 | –0.08 |
| Abstentions |
29,194 | 50.65 | +0.08 |
| Registered voters |
57,639 | |
|
| Source: Ministry of the Interior |
References
|
|---|
| General elections | |
|---|
| European elections | |
|---|
| Local elections | |
|---|
| Regional elections | |
|---|
| Referendums | |
|---|
- See also: Elections and referendums in Andalusia
- Aragon
- Asturias
- Balearic Islands
- Basque Country
- Canary Islands
- Cantabria
- Castile and León
- Castile-La Mancha
- Catalonia
- Extremadura
- Galicia
- Madrid
- Murcia
- Navarre
- La Rioja
- Valencian Community
|