Results breakdown of the Spanish general election, 2000 (Congress)
| |
Main: Spanish general election, 2000 | |||
|---|---|---|---|---|
| 12 March 2000 | ||||
 | ||||
 | ||||
| Party | Votes | % | MPs | |
| PP | 10,321,178 | 44.5% | 183 | |
| PSOE–p | 7,918,752 | 34.2% | 125 | |
| IU | 1,263,043 | 5.4% | 8 | |
| CiU | 970,421 | 4.2% | 15 | |
| EAJ/PNV | 353,953 | 1.5% | 7 | |
| BNG | 306,268 | 1.3% | 3 | |
| CC | 248,261 | 1.1% | 4 | |
| PA | 206,255 | 0.9% | 1 | |
| ERC | 194,715 | 0.8% | 1 | |
| Others | 1,398,444 | 6.0% | 3 | |
| Total | 23,181,290 | 100.0% | 350 | |
This is the results breakdown of the Congress of Deputies election held in Spain on 12 March 2000. The following tables show detailed results in each of the country's 17 autonomous communities and in the autonomous cities of Ceuta and Melilla, as well as a summary of constituency results.[1]
Electoral system
348 members of the Congress of Deputies were elected using the D'Hondt method and a closed list proportional representation, with a threshold of 3 per 100 of valid votes—which included blank ballots—being applied in each constituency. Parties not reaching the threshold were not taken into consideration for seat distribution. Additionally, the use of the D'Hondt method might result in an effective threshold over three percent, dependant on the district magnitude.[2] Seats were allocated to constituencies, corresponding to the provinces of Spain. Each constituency was entitled to an initial minimum of two seats, with the remaining 248 allocated among the constituencies in proportion to their populations. Ceuta and Melilla were allocated the two remaining seats, which were elected using plurality voting. Voting was on the basis of universal suffrage, with all nationals over eighteen and in full enjoyment of all political rights entitled to vote.
The electoral law provided that parties, federations, coalitions and groupings of electors were allowed to present lists of candidates. However, groupings of electors were required to secure at least the signature of 1 per 100 of the electors entered in electoral register of the constituency for which they were seeking election. Electors were barred from signing for more than one list of candidates. Concurrently, parties and federations intending to enter in coalition to take part jointly at an election were required to inform the relevant Electoral Commission within ten days from the election call.[3][4][5][6]
Nationwide
 | ||||||
| Parties and coalitions | Popular vote | Seats | ||||
|---|---|---|---|---|---|---|
| Votes | % | ±pp | Won | +/− | ||
| People's Party (PP) | 10,321,178 | 44.52 | +5.73 | 183 | +27 | |
| Spanish Socialist Workers' Party–Progressives (PSOE–p) | 7,918,752 | 34.16 | –3.47 | 125 | –16 | |
| United Left (IU)1 | 1,263,043 | 5.45 | –3.90 | 8 | –11 | |
| Convergence and Union (CiU) | 970,421 | 4.19 | –0.41 | 15 | –1 | |
| Basque Nationalist Party (EAJ/PNV) | 353,953 | 1.53 | +0.26 | 7 | +2 | |
| Galician Nationalist Bloc (BNG) | 306,268 | 1.32 | +0.44 | 3 | +1 | |
| Canarian Coalition (CC) | 248,261 | 1.07 | +0.19 | 4 | ±0 | |
| Andalusian Party (PA) | 206,255 | 0.89 | +0.35 | 1 | +1 | |
| Republican Left of Catalonia (ERC) | 194,715 | 0.84 | +0.17 | 1 | ±0 | |
| Initiative for Catalonia–Greens (IC–V)2 | 119,290 | 0.51 | –0.68 | 1 | –1 | |
| Basque Solidarity (EA) | 100,742 | 0.43 | –0.03 | 1 | ±0 | |
| Aragonese Union (CHA) | 75,356 | 0.33 | +0.13 | 1 | +1 | |
| Independent Liberal Group (GIL) | 72,162 | 0.31 | New | 0 | ±0 | |
| The Greens (LV)3 | 70,906 | 0.31 | +0.15 | 0 | ±0 | |
| Valencian Nationalist Bloc–The Greens–Valencians for Change (BNV–EV)4 | 58,551 | 0.25 | +0.06 | 0 | ±0 | |
| Valencian Union (UV) | 57,830 | 0.25 | –0.12 | 0 | –1 | |
| Leonese People's Union (UPL) | 41,690 | 0.18 | +0.13 | 0 | ±0 | |
| Aragonese Party (PAR) | 38,883 | 0.17 | New | 0 | ±0 | |
| Centrist Union–Democratic and Social Centre (UC–CDS) | 23,576 | 0.10 | –0.08 | 0 | ±0 | |
| PSM–Nationalist Agreement (PSM–EN) | 23,482 | 0.10 | ±0.00 | 0 | ±0 | |
| The Eco-pacifist Greens (LVEP) | 22,220 | 0.10 | New | 0 | ±0 | |
| Parties with less than 0.1% of the vote | 326,917 | 1.41 | — | 0 | –2 | |
|---|---|---|---|---|---|---|
| The Greens of the Community of Madrid (LVCM) | 21,087 | 0.09 | +0.06 | 0 | ±0 | |
| The Greens–Green Group (LV–GV) | 20,618 | 0.09 | +0.02 | 0 | ±0 | |
| Humanist Party (PH) | 19,683 | 0.08 | +0.03 | 0 | ±0 | |
| Commoners' Land–Castilian Nationalist Party (TC–PNC) | 18,290 | 0.08 | +0.06 | 0 | ±0 | |
| Natural Law Party (PLN) | 17,372 | 0.07 | New | 0 | ±0 | |
| The Falange (FE) | 14,431 | 0.06 | New | 0 | ±0 | |
| Asturian Renewal Union (URAS) | 13,360 | 0.06 | New | 0 | ±0 | |
| Communist Party of the Peoples of Spain (PCPE) | 12,898 | 0.06 | ±0.00 | 0 | ±0 | |
| Internationalist Socialist Workers' Party (POSI) | 12,208 | 0.05 | +0.04 | 0 | ±0 | |
| The Greens–Green Alternative (EV–AV) | 11,579 | 0.05 | New | 0 | ±0 | |
| Party of Independents from Lanzarote (PIL) | 10,323 | 0.04 | New | 0 | ±0 | |
| Spain 2000 Platform (ES2000) | 9,562 | 0.04 | New | 0 | ±0 | |
| Spanish Democratic Party (PADE) | 9,136 | 0.04 | New | 0 | ±0 | |
| Democrats' Convergence of Navarre (CDN) | 8,646 | 0.04 | –0.03 | 0 | ±0 | |
| Majorcan Union–Independents of Menorca (UM–INME) | 8,372 | 0.04 | +0.01 | 0 | ±0 | |
| Andalusian Left (IA) | 8,175 | 0.04 | New | 0 | ±0 | |
| Independent Spanish Falange–Falange 2000 (FEI–FE 2000) | 6,621 | 0.03 | +0.02 | 0 | ±0 | |
| Localist Bloc of Melilla (BLM) | 6,514 | 0.03 | New | 0 | ±0 | |
| Riojan Party (PR) | 6,155 | 0.03 | +0.01 | 0 | ±0 | |
| Asturianist Party (PAS) | 5,876 | 0.03 | –0.02 | 0 | ±0 | |
| Regionalist Unity of Castile and León (URCL) | 5,683 | 0.02 | ±0.00 | 0 | ±0 | |
| United Extremadura (EU) | 4,771 | 0.02 | New | 0 | ±0 | |
| Party of Self-employed and Professionals (AUTONOMO) | 4,218 | 0.02 | New | 0 | ±0 | |
| Independent Candidacy–The Party of Castile and León (CI–PCL) | 4,184 | 0.02 | New | 0 | ±0 | |
| Catalan State (EC) | 3,356 | 0.01 | New | 0 | ±0 | |
| Andalusian Nation (NA) | 3,262 | 0.01 | ±0.00 | 0 | ±0 | |
| Galician Democracy (DG) | 2,958 | 0.01 | New | 0 | ±0 | |
| Republican Action (AR) | 2,858 | 0.01 | +0.01 | 0 | ±0 | |
| Party of the Democratic Karma (PKD) | 2,759 | 0.01 | New | 0 | ±0 | |
| Andalusia Assembly (A) | 2,727 | 0.01 | New | 0 | ±0 | |
| Party of Self-employed, Retirees and Independents (EL–PAPI) | 2,713 | 0.01 | New | 0 | ±0 | |
| Extremaduran Coalition (PREx–CREx) | 2,371 | 0.01 | –0.02 | 0 | ±0 | |
| Galician Coalition (CG) | 2,361 | 0.01 | New | 0 | ±0 | |
| Zamoran People's Union (UPZ) | 2,347 | 0.01 | New | 0 | ±0 | |
| Galician People's Front (FPG) | 2,252 | 0.01 | ±0.00 | 0 | ±0 | |
| Carlist Party (PC) | 2,131 | 0.01 | New | 0 | ±0 | |
| Regionalist Party of the Leonese Country (PREPAL) | 2,118 | 0.01 | ±0.00 | 0 | ±0 | |
| Cantabrian Nationalist Council (CNC) | 2,103 | 0.01 | New | 0 | ±0 | |
| Andecha Astur (AA) | 2,036 | 0.01 | New | 0 | ±0 | |
| Self-employed Spanish Party (PEDA) | 1,904 | 0.01 | New | 0 | ±0 | |
| Internationalist Struggle (LI (LIT–CI)) | 1,716 | 0.01 | New | 0 | ±0 | |
| Party Association of Widows and Legal Wives (PAVIEL) | 1,690 | 0.01 | New | 0 | ±0 | |
| Republican Left–Left Republican Party (IR–PRE) | 1,541 | 0.01 | New | 0 | ±0 | |
| Party of Self-employed, Retirees and Widows (PAE) | 1,462 | 0.01 | +0.01 | 0 | ±0 | |
| Independent Salamancan Union (USI) | 1,416 | 0.01 | New | 0 | ±0 | |
| Independent Socialists of Extremadura (SIEx) | 1,412 | 0.01 | ±0.00 | 0 | ±0 | |
| Madrilenian Independent Regional Party (PRIM) | 1,363 | 0.01 | ±0.00 | 0 | ±0 | |
| Caló Nationalist Party (PNCA) | 1,331 | 0.01 | New | 0 | ±0 | |
| Party of El Bierzo (PB) | 1,191 | 0.01 | +0.01 | 0 | ±0 | |
| Asturian Left Bloc (BIA) | 1,085 | 0.00 | New | 0 | ±0 | |
| Aragonese Initiative (INAR) | 1,057 | 0.00 | New | 0 | ±0 | |
| Progressives of Canaries Unity (UP–CAN) | 980 | 0.00 | New | 0 | ±0 | |
| Valencian Nationalist Left (ENV) | 920 | 0.00 | ±0.00 | 0 | ±0 | |
| Almerian Regionalist Union (URAL) | 838 | 0.00 | New | 0 | ±0 | |
| Socialist Party of the People of Ceuta (PSPC) | 788 | 0.00 | –0.01 | 0 | ±0 | |
| European Nation State (N) | 710 | 0.00 | ±0.00 | 0 | ±0 | |
| Liberal and Social Democratic Coalition (CSD–L) | 650 | 0.00 | New | 0 | ±0 | |
| Citizens Convergence of the South-East (CCSE) | 645 | 0.00 | New | 0 | ±0 | |
| Federal Progressives (PF) | 609 | 0.00 | New | 0 | ±0 | |
| New Region (NR) | 598 | 0.00 | –0.01 | 0 | ±0 | |
| Christian Positivist Party (PPCr) | 546 | 0.00 | New | 0 | ±0 | |
| Balearic People's Union (UPB) | 524 | 0.00 | New | 0 | ±0 | |
| Voice of the Andalusian People (VDPA) | 493 | 0.00 | ±0.00 | 0 | ±0 | |
| Independent Initiative (II) | 425 | 0.00 | New | 0 | ±0 | |
| Regionalist Party of Guadalajara (PRGU) | 400 | 0.00 | ±0.00 | 0 | ±0 | |
| Iberian Union (UNIB) | 388 | 0.00 | New | 0 | ±0 | |
| New Force (FN) | 343 | 0.00 | New | 0 | ±0 | |
| Social and Autonomist Liberal Group (ALAS) | 339 | 0.00 | ±0.00 | 0 | ±0 | |
| Balearic Islands Renewal Party (PRIB) | 334 | 0.00 | New | 0 | ±0 | |
| Canarian Pensionist Tagoror (TPC) | 319 | 0.00 | New | 0 | ±0 | |
| National Union (UN) | 314 | 0.00 | New | 0 | ±0 | |
| Cives (Cives) | 206 | 0.00 | New | 0 | ±0 | |
| Movement for Humanist Socialism (MASH) | 121 | 0.00 | New | 0 | ±0 | |
| Democratic Party of the People (PDEP) | 85 | 0.00 | New | 0 | ±0 | |
| Nationalist Aprome (Aprome) | 60 | 0.00 | New | 0 | ±0 | |
| Basque Citizens (EH)5 | 0 | 0.00 | –0.72 | 0 | –2 | |
| Blank ballots | 366,823 | 1.58 | +0.61 | ||||||
| Total | 23,181,290 | 100.00 | 350 | ±0 | |||||
| Valid votes | 23,181,290 | 99.32 | –0.18 | ||||||
| Invalid votes | 158,200 | 0.68 | +0.18 | ||||||
| Votes cast / turnout | 23,339,490 | 68.71 | –8.67 | ||||||
| Abstentions | 10,630,150 | 31.29 | +8.67 | ||||||
| Registered voters | 33,969,640 | ||||||||
| Source(s): Ministry of the Interior, historiaelectoral.com | |||||||||
| |||||||||
Constituencies

| Constituency | PP | PSOE–p | IU | CiU | PNV | BNG | CC | PA | ERC | IC–V | EA | CHA | ||||||||||||
|---|---|---|---|---|---|---|---|---|---|---|---|---|---|---|---|---|---|---|---|---|---|---|---|---|
| % | S | % | S | % | S | % | S | % | S | % | S | % | S | % | S | % | S | % | S | % | S | % | S | |
| A Coruña | 51.9 | 5 | 24.8 | 2 | 1.4 | − | 19.3 | 2 | ||||||||||||||||
| Álava | 39.1 | 2 | 24.3 | 1 | 5.6 | − | 20.7 | 1 | 4.7 | − | ||||||||||||||
| Albacete | 51.2 | 2 | 41.2 | 2 | 5.0 | − | ||||||||||||||||||
| Alicante | 54.3 | 7 | 34.8 | 4 | 5.3 | − | 0.1 | − | ||||||||||||||||
| Almería | 48.7 | 3 | 42.3 | 2 | 4.2 | − | 2.4 | − | ||||||||||||||||
| Asturias | 46.3 | 5 | 37.0 | 3 | 10.3 | 1 | ||||||||||||||||||
| Ávila | 65.3 | 2 | 26.7 | 1 | 4.8 | − | ||||||||||||||||||
| Badajoz | 47.0 | 3 | 44.8 | 3 | 5.4 | − | ||||||||||||||||||
| Balearic Islands | 53.9 | 5 | 29.3 | 2 | 4.0 | − | 0.3 | − | ||||||||||||||||
| Barcelona | 23.5 | 8 | 35.5 | 12 | 2.5 | − | 26.3 | 9 | 5.1 | 1 | 4.1 | 1 | ||||||||||||
| Biscay | 27.3 | 3 | 22.9 | 2 | 5.8 | − | 34.2 | 4 | 5.1 | − | ||||||||||||||
| Burgos | 58.4 | 3 | 29.0 | 1 | 4.6 | − | ||||||||||||||||||
| Cáceres | 47.8 | 3 | 44.6 | 2 | 3.7 | − | ||||||||||||||||||
| Cádiz | 41.2 | 4 | 39.4 | 4 | 6.7 | − | 9.9 | 1 | ||||||||||||||||
| Cantabria | 56.8 | 3 | 33.5 | 2 | 5.0 | − | ||||||||||||||||||
| Castellón | 53.8 | 3 | 35.3 | 2 | 3.8 | − | 0.2 | − | ||||||||||||||||
| Ceuta | 47.6 | 1 | 18.0 | − | 0.8 | − | ||||||||||||||||||
| Ciudad Real | 51.7 | 3 | 42.6 | 2 | 3.7 | − | ||||||||||||||||||
| Córdoba | 40.9 | 3 | 40.5 | 3 | 11.9 | 1 | 4.5 | − | ||||||||||||||||
| Cuenca | 53.4 | 2 | 41.2 | 1 | 2.9 | − | ||||||||||||||||||
| Gipuzkoa | 24.6 | 2 | 23.7 | 1 | 4.7 | − | 27.7 | 2 | 14.1 | 1 | ||||||||||||||
| Girona | 15.9 | 1 | 28.4 | 2 | 1.5 | − | 41.0 | 2 | 8.7 | − | 1.8 | − | ||||||||||||
| Granada | 42.7 | 3 | 44.4 | 4 | 7.2 | − | 3.5 | − | ||||||||||||||||
| Guadalajara | 54.4 | 2 | 36.1 | 1 | 5.8 | − | ||||||||||||||||||
| Huelva | 40.2 | 2 | 46.9 | 3 | 6.4 | − | 4.7 | − | ||||||||||||||||
| Huesca | 45.1 | 2 | 37.1 | 1 | 3.1 | − | 5.5 | − | ||||||||||||||||
| Jaén | 40.3 | 3 | 47.7 | 3 | 7.1 | − | 3.3 | − | ||||||||||||||||
| La Rioja | 54.1 | 3 | 34.9 | 1 | 4.0 | − | ||||||||||||||||||
| Las Palmas | 48.0 | 4 | 18.4 | 1 | 2.5 | − | 25.8 | 2 | ||||||||||||||||
| León | 48.8 | 3 | 32.0 | 2 | 3.6 | − | ||||||||||||||||||
| Lleida | 21.0 | 1 | 27.6 | 1 | 1.0 | − | 39.0 | 2 | 7.2 | − | 1.8 | − | ||||||||||||
| Lugo | 58.0 | 3 | 22.9 | 1 | 1.0 | − | 16.2 | − | ||||||||||||||||
| Madrid | 52.5 | 19 | 33.1 | 12 | 9.1 | 3 | ||||||||||||||||||
| Málaga | 43.5 | 5 | 39.1 | 4 | 8.1 | 1 | 5.2 | − | ||||||||||||||||
| Melilla | 49.8 | 1 | 20.4 | − | 1.5 | − | ||||||||||||||||||
| Murcia | 58.1 | 6 | 32.4 | 3 | 6.2 | − | ||||||||||||||||||
| Navarre | 49.9 | 3 | 27.3 | 2 | 7.6 | − | 2.2 | − | 4.7 | − | ||||||||||||||
| Ourense | 57.2 | 3 | 23.1 | 1 | 0.7 | − | 17.0 | − | ||||||||||||||||
| Palencia | 55.5 | 2 | 35.8 | 1 | 4.2 | − | ||||||||||||||||||
| Pontevedra | 53.4 | 5 | 23.0 | 2 | 1.5 | − | 19.6 | 1 | ||||||||||||||||
| Salamanca | 58.5 | 3 | 32.7 | 1 | 3.7 | − | ||||||||||||||||||
| Santa Cruz de Tenerife | 35.0 | 3 | 26.3 | 2 | 2.3 | − | 33.7 | 2 | ||||||||||||||||
| Segovia | 57.5 | 2 | 30.8 | 1 | 5.2 | − | ||||||||||||||||||
| Seville | 35.0 | 5 | 49.0 | 7 | 8.3 | 1 | 5.1 | − | ||||||||||||||||
| Soria | 58.5 | 2 | 32.0 | 1 | 4.3 | − | ||||||||||||||||||
| Tarragona | 24.3 | 2 | 32.4 | 2 | 1.4 | − | 31.1 | 2 | 6.1 | − | 2.1 | − | ||||||||||||
| Teruel | 47.9 | 2 | 33.8 | 1 | 2.9 | − | 3.4 | − | ||||||||||||||||
| Toledo | 52.7 | 3 | 40.3 | 2 | 4.6 | − | ||||||||||||||||||
| Valencia | 50.5 | 9 | 33.2 | 6 | 6.5 | 1 | 0.1 | − | ||||||||||||||||
| Valladolid | 53.1 | 3 | 35.1 | 2 | 6.1 | − | ||||||||||||||||||
| Zamora | 58.8 | 2 | 32.4 | 1 | 2.8 | − | ||||||||||||||||||
| Zaragoza | 47.6 | 4 | 29.2 | 2 | 3.7 | − | 12.8 | 1 | ||||||||||||||||
| Total | 44.5 | 183 | 34.2 | 125 | 5.4 | 8 | 4.2 | 15 | 1.5 | 7 | 1.3 | 3 | 1.1 | 4 | 0.9 | 1 | 0.8 | 1 | 0.5 | 1 | 0.4 | 1 | 0.3 | 1 |
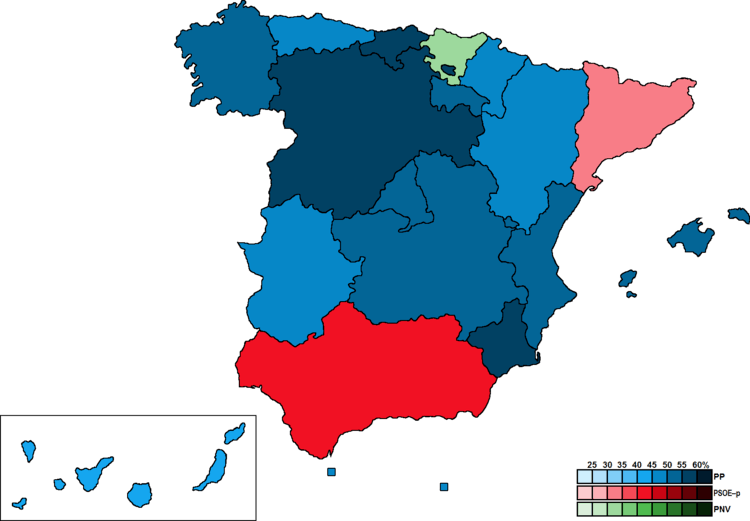
Regions
Summary
| Region | PP | PSOE–p | IU | CiU | PNV | BNG | CC | PA | ERC | IC–V | EA | CHA | ||||||||||||
|---|---|---|---|---|---|---|---|---|---|---|---|---|---|---|---|---|---|---|---|---|---|---|---|---|
| % | S | % | S | % | S | % | S | % | S | % | S | % | S | % | S | % | S | % | S | % | S | % | S | |
| Andalusia | 40.6 | 28 | 43.9 | 30 | 7.8 | 3 | 5.1 | 1 | ||||||||||||||||
| Aragon | 47.2 | 8 | 31.1 | 4 | 3.5 | − | 10.4 | 1 | ||||||||||||||||
| Asturias | 46.3 | 5 | 37.0 | 3 | 10.3 | 1 | ||||||||||||||||||
| Balearic Islands | 53.9 | 5 | 29.3 | 2 | 4.0 | − | 0.3 | − | ||||||||||||||||
| Basque Country | 28.3 | 7 | 23.3 | 4 | 5.4 | − | 30.4 | 7 | 7.6 | 1 | ||||||||||||||
| Canary Islands | 41.8 | 7 | 22.2 | 3 | 2.4 | − | 29.6 | 4 | ||||||||||||||||
| Cantabria | 56.8 | 3 | 33.5 | 2 | 5.0 | − | ||||||||||||||||||
| Castile and León | 55.7 | 22 | 32.2 | 11 | 4.4 | − | ||||||||||||||||||
| Castilla-La Mancha | 52.4 | 12 | 40.8 | 8 | 4.3 | − | ||||||||||||||||||
| Catalonia | 22.8 | 12 | 34.1 | 17 | 2.2 | − | 28.8 | 15 | 5.6 | 1 | 3.5 | 1 | ||||||||||||
| Ceuta | 47.6 | 1 | 18.0 | − | 0.8 | − | ||||||||||||||||||
| Extremadura | 47.3 | 6 | 44.7 | 5 | 4.7 | − | ||||||||||||||||||
| Galicia | 54.0 | 16 | 23.7 | 6 | 1.3 | − | 18.6 | 3 | ||||||||||||||||
| La Rioja | 54.1 | 3 | 34.9 | 1 | 4.0 | − | ||||||||||||||||||
| Madrid | 52.5 | 19 | 33.1 | 12 | 9.1 | 3 | ||||||||||||||||||
| Melilla | 49.8 | 1 | 20.4 | − | 1.5 | − | ||||||||||||||||||
| Murcia | 58.1 | 6 | 32.4 | 3 | 6.2 | − | ||||||||||||||||||
| Navarre | 49.9 | 3 | 27.3 | 2 | 7.6 | − | 2.2 | − | 4.7 | − | ||||||||||||||
| Valencian Community | 52.1 | 19 | 34.0 | 12 | 5.8 | 1 | 0.1 | – | ||||||||||||||||
| Total | 44.5 | 183 | 34.2 | 125 | 5.4 | 8 | 4.2 | 15 | 1.5 | 7 | 1.3 | 3 | 1.1 | 4 | 0.9 | 1 | 0.8 | 1 | 0.5 | 1 | 0.4 | 1 | 0.3 | 1 |
Autonomous communities
Andalusia

| Parties and coalitions | Popular vote | Seats | ||||
|---|---|---|---|---|---|---|
| Votes | % | ±pp | Won | +/− | ||
| Spanish Socialist Workers' Party–Progressives (PSOE–p) | 1,771,968 | 43.86 | –2.80 | 30 | –2 | |
| People's Party (PP) | 1,639,034 | 40.57 | +5.19 | 28 | +4 | |
| United Left/The Greens–Assembly for Andalusia (IULV–CA) | 315,891 | 7.82 | –5.66 | 3 | –3 | |
| Andalusian Party (PA) | 206,255 | 5.11 | +1.99 | 1 | +1 | |
| Parties with less than 1.0% of the vote | 51,618 | 1.28 | — | 0 | ±0 | |
|---|---|---|---|---|---|---|
| Independent Liberal Group (GIL) | 16,123 | 0.40 | New | 0 | ±0 | |
| Andalusian Left (IA) | 8,175 | 0.20 | New | 0 | ±0 | |
| Communist Party of the Peoples of Spain (PCPE) | 3,559 | 0.09 | –0.03 | 0 | ±0 | |
| Andalusian Nation (NA) | 3,262 | 0.08 | ±0.00 | 0 | ±0 | |
| Humanist Party (PH) | 3,197 | 0.08 | +0.02 | 0 | ±0 | |
| Andalusia Assembly (A) | 2,727 | 0.07 | New | 0 | ±0 | |
| Natural Law Party (PLN) | 2,430 | 0.06 | New | 0 | ±0 | |
| The Falange (FE) | 2,388 | 0.06 | New | 0 | ±0 | |
| Centrist Union–Democratic and Social Centre (UC–CDS) | 2,074 | 0.05 | –0.02 | 0 | ±0 | |
| Spain 2000 Platform (ES2000) | 1,584 | 0.04 | New | 0 | ±0 | |
| Spanish Democratic Party (PADE) | 1,481 | 0.04 | New | 0 | ±0 | |
| Independent Spanish Falange–Falange 2000 (FEI–FE 2000) | 1,203 | 0.03 | +0.02 | 0 | ±0 | |
| Internationalist Socialist Workers' Party (POSI) | 921 | 0.02 | New | 0 | ±0 | |
| Almerian Regionalist Union (URAL) | 838 | 0.02 | New | 0 | ±0 | |
| Christian Positivist Party (PPCr) | 546 | 0.01 | New | 0 | ±0 | |
| Voice of the Andalusian People (VDPA) | 493 | 0.01 | ±0.00 | 0 | ±0 | |
| National Union (UN) | 314 | 0.00 | New | 0 | ±0 | |
| Republican Action (AR) | 303 | 0.01 | New | 0 | ±0 | |
| Blank ballots | 55,486 | 1.37 | +0.54 | |||
| Total | 4,040,252 | 100.00 | 62 | ±0 | ||
| Valid votes | 4,040,252 | 99.30 | –0.12 | |||
| Invalid votes | 28,541 | 0.70 | +0.12 | |||
| Votes cast / turnout | 4,068,793 | 68.77 | –9.23 | |||
| Abstentions | 1,847,990 | 31.23 | +9.23 | |||
| Registered voters | 5,916,783 | |||||
| Source: Ministry of the Interior | ||||||
Aragon
| Parties and coalitions | Popular vote | Seats | ||||
|---|---|---|---|---|---|---|
| Votes | % | ±pp | Won | +/− | ||
| People's Party (PP) | 341,396 | 47.23 | –0.69 | 8 | ±0 | |
| Spanish Socialist Workers' Party–Progressives (PSOE–p) | 224,650 | 31.08 | –3.56 | 4 | –1 | |
| Aragonese Union (CHA) | 75,356 | 10.42 | +4.00 | 1 | +1 | |
| Aragonese Party (PAR) | 38,883 | 5.38 | New | 0 | ±0 | |
| United Left of Aragon (IU) | 25,395 | 3.51 | –5.63 | 0 | ±0 | |
| Parties with less than 1.0% of the vote | 6,707 | 0.93 | — | 0 | ±0 | |
|---|---|---|---|---|---|---|
| The Greens–Green Group–SOS Nature (LV–GV) | 3,774 | 0.52 | +0.16 | 0 | ±0 | |
| Aragonese Initiative (INAR) | 1,057 | 0.15 | New | 0 | ±0 | |
| The Falange (FE) | 374 | 0.05 | New | 0 | ±0 | |
| Humanist Party (PH) | 348 | 0.05 | +0.01 | 0 | ±0 | |
| Natural Law Party (PLN) | 283 | 0.04 | New | 0 | ±0 | |
| Spain 2000 Platform (ES2000) | 205 | 0.03 | New | 0 | ±0 | |
| Centrist Union–Democratic and Social Centre (UC–CDS) | 194 | 0.03 | –0.04 | 0 | ±0 | |
| Independent Spanish Falange–Falange 2000 (FEI–FE 2000) | 192 | 0.03 | New | 0 | ±0 | |
| Catalan State (EC) | 162 | 0.02 | New | 0 | ±0 | |
| Spanish Democratic Party (PADE) | 118 | 0.02 | New | 0 | ±0 | |
| Blank ballots | 10,473 | 1.45 | +0.24 | |||
| Total | 722,860 | 100.00 | 13 | ±0 | ||
| Valid votes | 722,860 | 99.29 | –0.22 | |||
| Invalid votes | 5,200 | 0.71 | +0.22 | |||
| Votes cast / turnout | 728,060 | 71.39 | –6.07 | |||
| Abstentions | 291,785 | 28.61 | +6.07 | |||
| Registered voters | 1,019,845 | |||||
| Source: Ministry of the Interior | ||||||
Asturias
| Parties and coalitions | Popular vote | Seats | ||||
|---|---|---|---|---|---|---|
| Votes | % | ±pp | Won | +/− | ||
| People's Party (PP) | 302,626 | 46.33 | +5.30 | 5 | +1 | |
| Spanish Socialist Workers' Party–Progressives (PSOE–p) | 241,830 | 37.02 | –2.83 | 3 | –1 | |
| United Left (IU) | 67,024 | 10.26 | –5.25 | 1 | ±0 | |
| Asturian Renewal Union (URAS) | 13,360 | 2.05 | New | 0 | ±0 | |
| Parties with less than 1.0% of the vote | 17,409 | 2.67 | — | 0 | ±0 | |
|---|---|---|---|---|---|---|
| Asturianist Party (PAS) | 5,876 | 0.90 | –0.79 | 0 | ±0 | |
| The Greens of Asturias (LV) | 4,874 | 0.75 | +0.26 | 0 | ±0 | |
| Andecha Astur (AA) | 2,036 | 0.31 | +0.20 | 0 | ±0 | |
| Asturian Left Bloc (BIA) | 1,085 | 0.17 | New | 0 | ±0 | |
| Party of Self-employed and Professionals (AUTONOMO) | 1,036 | 0.16 | New | 0 | ±0 | |
| Centrist Union–Democratic and Social Centre (UC–CDS) | 658 | 0.10 | –0.14 | 0 | ±0 | |
| Spain 2000 Platform (ES2000) | 607 | 0.09 | New | 0 | ±0 | |
| Humanist Party (PH) | 329 | 0.05 | New | 0 | ±0 | |
| The Falange (FE) | 295 | 0.05 | New | 0 | ±0 | |
| Natural Law Party (PLN) | 280 | 0.04 | New | 0 | ±0 | |
| Independent Spanish Falange–Falange 2000 (FEI–FE 2000) | 173 | 0.03 | New | 0 | ±0 | |
| Spanish Democratic Party (PADE) | 160 | 0.02 | New | 0 | ±0 | |
| Blank ballots | 10,985 | 1.68 | +0.74 | |||
| Total | 653,234 | 100.00 | 9 | ±0 | ||
| Valid votes | 653,234 | 99.34 | –0.18 | |||
| Invalid votes | 4,319 | 0.66 | +0.18 | |||
| Votes cast / turnout | 657,553 | 66.99 | –8.92 | |||
| Abstentions | 323,951 | 33.01 | +8.92 | |||
| Registered voters | 981,504 | |||||
| Source: Ministry of the Interior | ||||||
Balearic Islands
| Parties and coalitions | Popular vote | Seats | ||||
|---|---|---|---|---|---|---|
| Votes | % | ±pp | Won | +/− | ||
| People's Party (PP) | 214,348 | 53.87 | +7.46 | 5 | +1 | |
| Spanish Socialist Workers' Party–Progressives (PSOE–p) | 116,515 | 29.28 | –6.67 | 2 | –1 | |
| PSM–Nationalist Agreement (PSM–EN) | 23,482 | 5.90 | +0.19 | 0 | ±0 | |
| United Left of the Balearic Islands (EU) | 15,928 | 4.00 | –3.69 | 0 | ±0 | |
| The Greens of the Balearic Islands (EVIB) | 9,556 | 2.40 | +0.18 | 0 | ±0 | |
| Majorcan Union–Independents of Menorca (UM–INME) | 8,372 | 2.10 | +0.49 | 0 | ±0 | |
| Parties with less than 1.0% of the vote | 3,754 | 0.94 | — | 0 | − | |
|---|---|---|---|---|---|---|
| Republican Left of Catalonia (ERC) | 1,340 | 0.34 | –0.08 | 0 | ±0 | |
| Balearic People's Union (UPB) | 524 | 0.13 | New | 0 | ±0 | |
| Workers for Democracy Coalition (TD) | 423 | 0.11 | +0.02 | 0 | ±0 | |
| Centrist Union–Democratic and Social Centre (UC–CDS) | 341 | 0.09 | –0.01 | 0 | ±0 | |
| Balearic Islands Renewal Party (PRIB) | 334 | 0.08 | New | 0 | ±0 | |
| Spain 2000 Platform (ES2000) | 221 | 0.06 | New | 0 | ±0 | |
| The Falange (FE) | 220 | 0.06 | New | 0 | ±0 | |
| Independent Spanish Falange–Falange 2000 (FEI–FE 2000) | 182 | 0.05 | New | 0 | ±0 | |
| Catalan State (EC) | 169 | 0.04 | New | 0 | ±0 | |
| Blank ballots | 5,943 | 1.49 | +0.49 | |||
| Total | 397,898 | 100.00 | 7 | ±0 | ||
| Valid votes | 397,898 | 99.34 | –0.08 | |||
| Invalid votes | 2,661 | 0.66 | +0.08 | |||
| Votes cast / turnout | 400,559 | 61.43 | –10.20 | |||
| Abstentions | 251,450 | 38.57 | +10.20 | |||
| Registered voters | 652,009 | |||||
| Source: Ministry of the Interior | ||||||
Basque Country

| Parties and coalitions | Popular vote | Seats | ||||
|---|---|---|---|---|---|---|
| Votes | % | ±pp | Won | +/− | ||
| Basque Nationalist Party (EAJ/PNV) | 347,417 | 30.38 | +5.34 | 7 | +2 | |
| People's Party (PP) | 323,235 | 28.26 | +9.92 | 7 | +2 | |
| Socialist Party of the Basque Country–Basque Country Left (PSE–EE (PSOE)) | 266,583 | 23.31 | –0.36 | 4 | –1 | |
| Basque Solidarity (EA) | 86,557 | 7.57 | –0.65 | 1 | ±0 | |
| United Left (EB/IU) | 62,293 | 5.45 | –3.76 | 0 | –1 | |
| Parties with less than 1.0% of the vote | 23,234 | 2.03 | — | 0 | –2 | |
|---|---|---|---|---|---|---|
| The Greens (B/LV) | 10,121 | 0.88 | +0.40 | 0 | ±0 | |
| Humanist Party (PH) | 3,058 | 0.27 | +0.19 | 0 | ±0 | |
| Party of the Democratic Karma (PKD) | 2,759 | 0.24 | New | 0 | ±0 | |
| Natural Law Party (PLN) | 2,378 | 0.21 | New | 0 | ±0 | |
| Internationalist Socialist Workers' Party (POSI) | 1,297 | 0.11 | New | 0 | ±0 | |
| Democratic and Social Centre–Centrist Union (CDS–UC) | 709 | 0.06 | –0.01 | 0 | ±0 | |
| Communist Party of the Peoples of Spain (PCPE) | 534 | 0.05 | New | 0 | ±0 | |
| Spain 2000 Platform (ES2000) | 502 | 0.04 | New | 0 | ±0 | |
| Republican Action (AR) | 451 | 0.04 | New | 0 | ±0 | |
| Carlist Party (EKA/PC) | 430 | 0.04 | New | 0 | ±0 | |
| The Falange (FE) | 410 | 0.04 | New | 0 | ±0 | |
| Internationalist Struggle (LI (LIT–CI)) | 331 | 0.03 | New | 0 | ±0 | |
| Independent Spanish Falange–Falange 2000 (FEI–FE 2000) | 254 | 0.02 | +0.01 | 0 | ±0 | |
| Basque Citizens (EH)1 | 0 | 0.00 | –12.28 | 0 | –2 | |
| Blank ballots | 34,381 | 3.01 | +1.46 | ||||||
| Total | 1,143,700 | 100.00 | 19 | ±0 | |||||
| Valid votes | 1,143,700 | 98.94 | –0.37 | ||||||
| Invalid votes | 12,299 | 1.06 | +0.37 | ||||||
| Votes cast / turnout | 1,155,999 | 63.84 | –7.69 | ||||||
| Abstentions | 654,667 | 36.16 | +7.69 | ||||||
| Registered voters | 1,810,666 | ||||||||
| Source: Ministry of the Interior | |||||||||
| |||||||||
Canary Islands

| Parties and coalitions | Popular vote | Seats | ||||
|---|---|---|---|---|---|---|
| Votes | % | ±pp | Won | +/− | ||
| People's Party (PP) | 351,110 | 41.81 | +4.19 | 7 | +2 | |
| Canarian Coalition (CC) | 248,261 | 29.56 | +4.47 | 4 | ±0 | |
| Spanish Socialist Workers' Party–Progressives (PSOE–p) | 186,363 | 22.19 | –7.78 | 3 | –2 | |
| Canarian United Left (IUC) | 20,214 | 2.41 | –3.07 | 0 | ±0 | |
| Party of Independents from Lanzarote (PIL) | 10,323 | 1.23 | New | 0 | ±0 | |
| The Greens of Canaries (LV) | 10,302 | 1.23 | New | 0 | ±0 | |
| Parties with less than 1.0% of the vote | 6,008 | 0.72 | — | 0 | ±0 | |
|---|---|---|---|---|---|---|
| Communist Party of the Canarian People (PCPC) | 1,408 | 0.17 | +0.04 | 0 | ±0 | |
| Humanist Party (PH) | 1,131 | 0.13 | +0.05 | 0 | ±0 | |
| Centrist Union–Democratic and Social Centre (UC–CDS) | 1,060 | 0.13 | ±0.00 | 0 | ±0 | |
| Progressives of Canaries Unity (UP–CAN) | 980 | 0.12 | New | 0 | ±0 | |
| The Falange (FE) | 809 | 0.10 | New | 0 | ±0 | |
| Canarian Pensionist Tagoror (TPC) | 319 | 0.04 | New | 0 | ±0 | |
| Natural Law Party (PLN) | 301 | 0.04 | New | 0 | ±0 | |
| Blank ballots | 7,233 | 0.86 | +0.29 | |||
| Total | 839,814 | 100.00 | 14 | ±0 | ||
| Valid votes | 839,814 | 99.35 | –0.23 | |||
| Invalid votes | 5,534 | 0.65 | +0.23 | |||
| Votes cast / turnout | 845,348 | 60.67 | –8.47 | |||
| Abstentions | 548,062 | 39.33 | +8.47 | |||
| Registered voters | 1,393,410 | |||||
| Source: Ministry of the Interior | ||||||
Cantabria

| Parties and coalitions | Popular vote | Seats | ||||
|---|---|---|---|---|---|---|
| Votes | % | ±pp | Won | +/− | ||
| People's Party (PP) | 189,442 | 56.84 | +6.37 | 3 | ±0 | |
| Spanish Socialist Workers' Party–Progressives (PSOE–p) | 111,556 | 33.47 | –2.14 | 2 | ±0 | |
| United Left (IU) | 16,714 | 5.02 | –6.34 | 0 | ±0 | |
| Parties with less than 1.0% of the vote | 6,830 | 2.05 | — | 0 | ±0 | |
|---|---|---|---|---|---|---|
| Cantabrian Nationalist Council (CNC) | 2,103 | 0.63 | New | 0 | ±0 | |
| Independent Liberal Group (GIL) | 1,343 | 0.40 | New | 0 | ±0 | |
| Centrist Union–Democratic and Social Centre (UC–CDS) | 743 | 0.22 | –0.18 | 0 | ±0 | |
| Natural Law Party (PLN) | 598 | 0.18 | New | 0 | ±0 | |
| Communist Party of the Peoples of Spain (PCPE) | 536 | 0.16 | –0.02 | 0 | ±0 | |
| Humanist Party (PH) | 353 | 0.11 | –0.06 | 0 | ±0 | |
| Internationalist Socialist Workers' Party (POSI) | 328 | 0.10 | New | 0 | ±0 | |
| The Falange (FE) | 293 | 0.09 | New | 0 | ±0 | |
| Independent Spanish Falange–Falange 2000 (FEI–FE 2000) | 194 | 0.06 | New | 0 | ±0 | |
| Spain 2000 Platform (ES2000) | 183 | 0.05 | New | 0 | ±0 | |
| Spanish Democratic Party (PADE) | 156 | 0.05 | New | 0 | ±0 | |
| Blank ballots | 8,726 | 2.62 | +1.02 | |||
| Total | 333,268 | 100.00 | 5 | ±0 | ||
| Valid votes | 333,268 | 99.04 | –0.25 | |||
| Invalid votes | 3,240 | 0.96 | +0.25 | |||
| Votes cast / turnout | 336,508 | 71.81 | –7.50 | |||
| Abstentions | 132,099 | 28.19 | +7.50 | |||
| Registered voters | 468,607 | |||||
| Source: Ministry of the Interior | ||||||
Castile and León
| Parties and coalitions | Popular vote | Seats | ||||
|---|---|---|---|---|---|---|
| Votes | % | ±pp | Won | +/− | ||
| People's Party (PP) | 876,670 | 55.68 | +3.48 | 22 | ±0 | |
| Spanish Socialist Workers' Party–Progressives (PSOE–p) | 506,595 | 32.17 | –2.86 | 11 | ±0 | |
| United Left (IU) | 69,835 | 4.44 | –4.69 | 0 | ±0 | |
| Leonese People's Union (UPL) | 41,690 | 2.65 | +1.93 | 0 | ±0 | |
| Parties with less than 1.0% of the vote | 48,032 | 3.05 | — | 0 | ±0 | |
|---|---|---|---|---|---|---|
| Commoners' Land–Castilian Nationalist Party (TC–PNC) | 15,414 | 0.98 | +0.67 | 0 | ±0 | |
| Regionalist Unity of Castile and León (URCL) | 5,683 | 0.36 | +0.12 | 0 | ±0 | |
| Centrist Union–Democratic and Social Centre (UC–CDS) | 5,353 | 0.34 | –0.10 | 0 | ±0 | |
| Independent Candidacy–The Party of Castile and León (CI–PCL) | 4,184 | 0.27 | New | 0 | ±0 | |
| Natural Law Party (PLN) | 2,618 | 0.17 | New | 0 | ±0 | |
| Zamoran People's Union (UPZ) | 2,347 | 0.15 | New | 0 | ±0 | |
| Regionalist Party of the Leonese Country (PREPAL) | 2,118 | 0.13 | +0.01 | 0 | ±0 | |
| Humanist Party (PH) | 1,592 | 0.10 | +0.01 | 0 | ±0 | |
| Independent Salamancan Union (USI) | 1,416 | 0.09 | New | 0 | ±0 | |
| The Falange (FE) | 1,348 | 0.09 | New | 0 | ±0 | |
| Party of El Bierzo (PB) | 1,191 | 0.08 | +0.02 | 0 | ±0 | |
| Spanish Democratic Party (PADE) | 1,156 | 0.07 | New | 0 | ±0 | |
| The Greens–Green Group (LV–GV) | 1,143 | 0.07 | +0.02 | 0 | ±0 | |
| Communist Party of the Peoples of Spain (PCPE) | 876 | 0.06 | +0.03 | 0 | ±0 | |
| Spain 2000 Platform (ES2000) | 711 | 0.05 | New | 0 | ±0 | |
| Independent Spanish Falange–Falange 2000 (FEI–FE 2000) | 557 | 0.04 | New | 0 | ±0 | |
| Cives (Cives) | 206 | 0.01 | New | 0 | ±0 | |
| Carlist Party (PC) | 119 | 0.01 | New | 0 | ±0 | |
| Blank ballots | 31,679 | 2.01 | +0.66 | |||
| Total | 1,574,501 | 100.00 | 33 | ±0 | ||
| Valid votes | 1,574,501 | 99.22 | –0.16 | |||
| Invalid votes | 12,449 | 0.78 | +0.16 | |||
| Votes cast / turnout | 1,586,950 | 72.57 | –6.44 | |||
| Abstentions | 599,709 | 27.43 | +6.44 | |||
| Registered voters | 2,186,659 | |||||
| Source: Ministry of the Interior | ||||||
Castilla-La Mancha
| Parties and coalitions | Popular vote | Seats | ||||
|---|---|---|---|---|---|---|
| Votes | % | ±pp | Won | +/− | ||
| People's Party (PP) | 563,203 | 52.36 | +5.18 | 12 | +1 | |
| Spanish Socialist Workers' Party–Progressives (PSOE–p) | 438,630 | 40.78 | –1.84 | 8 | –1 | |
| United Left (IU) | 46,746 | 4.35 | –4.05 | 0 | ±0 | |
| Parties with less than 1.0% of the vote | 12,655 | 1.18 | — | 0 | ±0 | |
|---|---|---|---|---|---|---|
| Independent Liberal Group (GIL) | 2,698 | 0.25 | New | 0 | ±0 | |
| Natural Law Party (PLN) | 1,736 | 0.16 | New | 0 | ±0 | |
| Commoners' Land–Castilian Nationalist Party (TC–PNC) | 1,612 | 0.15 | +0.07 | 0 | ±0 | |
| Centrist Union–Democratic and Social Centre (UC–CDS) | 1,372 | 0.13 | –0.17 | 0 | ±0 | |
| Humanist Party (PH) | 1,262 | 0.12 | +0.03 | 0 | ±0 | |
| The Falange (FE) | 875 | 0.08 | New | 0 | ±0 | |
| The Greens–Green Group (LV–GV) | 605 | 0.06 | New | 0 | ±0 | |
| Spain 2000 Platform (ES2000) | 589 | 0.05 | New | 0 | ±0 | |
| Spanish Democratic Party (PADE) | 573 | 0.05 | New | 0 | ±0 | |
| Regionalist Party of Guadalajara (PRGU) | 400 | 0.04 | +0.01 | 0 | ±0 | |
| Party of Self-employed, Retirees and Independents (EL–PAPI) | 377 | 0.04 | New | 0 | ±0 | |
| Party of Self-employed, Retirees and Widows (PAE) | 268 | 0.02 | New | 0 | ±0 | |
| Independent Spanish Falange–Falange 2000 (FEI–FE 2000) | 130 | 0.01 | New | 0 | ±0 | |
| Carlist Party (PC) | 97 | 0.01 | New | 0 | ±0 | |
| Republican Action (AR) | 61 | 0.01 | New | 0 | ±0 | |
| Blank ballots | 14,328 | 1.33 | +0.43 | |||
| Total | 1,075,571 | 100.00 | 20 | ±0 | ||
| Valid votes | 1,075,571 | 99.20 | –0.17 | |||
| Invalid votes | 8,665 | 0.80 | +0.17 | |||
| Votes cast / turnout | 1,084,236 | 76.31 | –6.78 | |||
| Abstentions | 336,658 | 23.69 | +6.78 | |||
| Registered voters | 1,420,894 | |||||
| Source: Ministry of the Interior | ||||||
Catalonia
| Parties and coalitions | Popular vote | Seats | ||||
|---|---|---|---|---|---|---|
| Votes | % | ±pp | Won | +/− | ||
| Socialists' Party of Catalonia (PSC–PSOE) | 1,150,533 | 34.13 | –5.23 | 17 | –2 | |
| Convergence and Union (CiU) | 970,421 | 28.79 | –0.82 | 15 | –1 | |
| People's Party (PP) | 768,318 | 22.79 | +4.83 | 12 | +4 | |
| Republican Left of Catalonia (ERC) | 190,292 | 5.64 | +1.46 | 1 | ±0 | |
| Initiative for Catalonia–Greens (IC–V) | 119,290 | 3.54 | –4.10 | 1 | –1 | |
| United and Alternative Left (EUiA) | 75,091 | 2.23 | New | 0 | ±0 | |
| Parties with less than 1.0% of the vote | 49,801 | 1.48 | — | 0 | ±0 | |
|---|---|---|---|---|---|---|
| The Greens–Green Group (EV–GV) | 14,922 | 0.44 | New | 0 | ±0 | |
| The Greens–Green Alternative (EV–AV) | 11,579 | 0.34 | New | 0 | ±0 | |
| Internationalist Socialist Workers' Party (POSI) | 4,751 | 0.14 | New | 0 | ±0 | |
| Independent Liberal Group (GIL) | 3,002 | 0.09 | New | 0 | ±0 | |
| Catalan State (EC) | 2,321 | 0.07 | New | 0 | ±0 | |
| Centrist Union–Democratic and Social Centre (UC–CDS) | 1,980 | 0.06 | –0.01 | 0 | ±0 | |
| Humanist Party (PH) | 1,820 | 0.05 | +0.01 | 0 | ±0 | |
| Republican Left–Left Republican Party (IR–PRE) | 1,541 | 0.05 | New | 0 | ±0 | |
| Natural Law Party (PLN) | 1,474 | 0.04 | New | 0 | ±0 | |
| The Falange (FE) | 1,371 | 0.04 | New | 0 | ±0 | |
| Caló Nationalist Party (PNCA) | 1,142 | 0.03 | New | 0 | ±0 | |
| Spain 2000 Platform (ES2000) | 855 | 0.03 | New | 0 | ±0 | |
| Independent Spanish Falange–Falange 2000 (FEI–FE 2000) | 826 | 0.02 | New | 0 | ±0 | |
| Internationalist Struggle (LI (LIT–CI)) | 816 | 0.02 | New | 0 | ±0 | |
| European Nation State (N) | 710 | 0.02 | +0.01 | 0 | ±0 | |
| Spanish Democratic Party (PADE) | 606 | 0.02 | New | 0 | ±0 | |
| Democratic Party of the People (PDEP) | 85 | 0.00 | New | 0 | ±0 | |
| Blank ballots | 47,526 | 1.41 | +0.75 | |||
| Total | 3,371,272 | 100.00 | 46 | ±0 | ||
| Valid votes | 3,371,272 | 99.50 | –0.17 | |||
| Invalid votes | 16,856 | 0.50 | +0.17 | |||
| Votes cast / turnout | 3,388,128 | 64.01 | –12.51 | |||
| Abstentions | 1,905,337 | 35.99 | +12.51 | |||
| Registered voters | 5,293,465 | |||||
| Source: Ministry of the Interior | ||||||
Extremadura
| Parties and coalitions | Popular vote | Seats | ||||
|---|---|---|---|---|---|---|
| Votes | % | ±pp | Won | +/− | ||
| People's Party (PP) | 310,850 | 47.30 | +7.02 | 6 | +1 | |
| Spanish Socialist Workers' Party–Progressives (PSOE–p) | 293,831 | 44.71 | –3.72 | 5 | –1 | |
| United Left (IU) | 30,865 | 4.70 | –4.20 | 0 | ±0 | |
| Parties with less than 1.0% of the vote | 13,997 | 2.13 | — | 0 | ±0 | |
|---|---|---|---|---|---|---|
| United Extremadura (EU) | 4,771 | 0.73 | New | 0 | ±0 | |
| The Greens of Extremadura (LV) | 3,417 | 0.52 | New | 0 | ±0 | |
| Extremaduran Coalition (PREx–CREx) | 2,371 | 0.36 | –0.68 | 0 | ±0 | |
| Independent Socialists of Extremadura (SIEx) | 1,412 | 0.21 | –0.03 | 0 | ±0 | |
| Centrist Union–Democratic and Social Centre (UC–CDS) | 525 | 0.08 | –0.06 | 0 | ±0 | |
| The Falange (FE) | 461 | 0.07 | New | 0 | ±0 | |
| Natural Law Party (PLN) | 326 | 0.05 | New | 0 | ±0 | |
| Humanist Party (PH) | 198 | 0.03 | +0.01 | 0 | ±0 | |
| Spain 2000 Platform (ES2000) | 191 | 0.03 | New | 0 | ±0 | |
| Spanish Democratic Party (PADE) | 188 | 0.03 | New | 0 | ±0 | |
| Independent Spanish Falange–Falange 2000 (FEI–FE 2000) | 137 | 0.02 | –0.01 | 0 | ±0 | |
| Blank ballots | 7,605 | 1.16 | +0.44 | |||
| Total | 657,148 | 100.00 | 11 | ±0 | ||
| Valid votes | 657,148 | 99.21 | –0.36 | |||
| Invalid votes | 5,245 | 0.79 | +0.36 | |||
| Votes cast / turnout | 662,393 | 75.42 | –6.91 | |||
| Abstentions | 215,899 | 24.58 | +6.91 | |||
| Registered voters | 878,292 | |||||
| Source: Ministry of the Interior | ||||||
Galicia

| Parties and coalitions | Popular vote | Seats | ||||
|---|---|---|---|---|---|---|
| Votes | % | ±pp | Won | +/− | ||
| People's Party (PP) | 888,092 | 53.99 | +5.68 | 16 | +2 | |
| Socialists' Party of Galicia–Progressives (PSdeG–PSOE–p) | 389,999 | 23.71 | –9.83 | 6 | –3 | |
| Galician Nationalist Bloc (BNG) | 306,268 | 18.62 | +5.77 | 3 | +1 | |
| United Left (EU–IU) | 21,127 | 1.28 | –2.35 | 0 | ±0 | |
| Parties with less than 1.0% of the vote | 17,849 | 1.09 | — | 0 | ±0 | |
|---|---|---|---|---|---|---|
| Party of Self-employed and Professionals (AUTONOMO) | 3,182 | 0.19 | New | 0 | ±0 | |
| Galician Democracy (DG) | 2,958 | 0.18 | New | 0 | ±0 | |
| Galician Coalition (CG) | 2,361 | 0.14 | New | 0 | ±0 | |
| Galician People's Front (FPG) | 2,252 | 0.14 | +0.02 | 0 | ±0 | |
| Humanist Party (PH) | 1,911 | 0.12 | +0.04 | 0 | ±0 | |
| Centrist Union–Democratic and Social Centre (UC–CDS) | 1,724 | 0.10 | –0.05 | 0 | ±0 | |
| Spain 2000 Platform (ES2000) | 929 | 0.06 | New | 0 | ±0 | |
| The Falange (FE) | 893 | 0.05 | New | 0 | ±0 | |
| Natural Law Party (PLN) | 716 | 0.04 | New | 0 | ±0 | |
| Spanish Democratic Party (PADE) | 594 | 0.04 | New | 0 | ±0 | |
| Independent Spanish Falange–Falange 2000 (FEI–FE 2000) | 329 | 0.02 | New | 0 | ±0 | |
| Blank ballots | 21,703 | 1.32 | +0.40 | |||
| Total | 1,645,045 | 100.00 | 25 | ±0 | ||
| Valid votes | 1,645,045 | 99.30 | –0.05 | |||
| Invalid votes | 11,617 | 0.70 | +0.05 | |||
| Votes cast / turnout | 1,656,662 | 65.02 | –6.38 | |||
| Abstentions | 891,119 | 34.98 | +6.38 | |||
| Registered voters | 2,547,781 | |||||
| Source: Ministry of the Interior | ||||||
La Rioja
| Parties and coalitions | Popular vote | Seats | ||||
|---|---|---|---|---|---|---|
| Votes | % | ±pp | Won | +/− | ||
| People's Party (PP) | 91,810 | 54.10 | +4.69 | 3 | +1 | |
| Spanish Socialist Workers' Party–Progressives (PSOE–p) | 59,171 | 34.87 | –1.78 | 1 | –1 | |
| United Left (IU) | 6,830 | 4.02 | –4.69 | 0 | ±0 | |
| Riojan Party (PR) | 6,155 | 3.63 | +0.23 | 0 | ±0 | |
| The Greens (LV) | 1,709 | 1.01 | New | 0 | ±0 | |
| Parties with less than 1.0% of the vote | 755 | 0.44 | — | 0 | ±0 | |
|---|---|---|---|---|---|---|
| Spanish Democratic Party (PADE) | 139 | 0.08 | New | 0 | ±0 | |
| Centrist Union–Democratic and Social Centre (UC–CDS) | 131 | 0.08 | –0.18 | 0 | ±0 | |
| Movement for Humanist Socialism (MASH) | 121 | 0.07 | New | 0 | ±0 | |
| The Falange (FE) | 104 | 0.06 | New | 0 | ±0 | |
| Humanist Party (PH) | 79 | 0.05 | New | 0 | ±0 | |
| Natural Law Party (PLN) | 79 | 0.05 | New | 0 | ±0 | |
| Carlist Party (PC) | 56 | 0.03 | New | 0 | ±0 | |
| Spain 2000 Platform (ES2000) | 46 | 0.03 | New | 0 | ±0 | |
| Blank ballots | 3,265 | 1.92 | +0.45 | |||
| Total | 169,695 | 100.00 | 4 | ±0 | ||
| Valid votes | 169,695 | 99.24 | –0.16 | |||
| Invalid votes | 1,302 | 0.76 | +0.16 | |||
| Votes cast / turnout | 170,997 | 74.21 | –6.71 | |||
| Abstentions | 59,430 | 25.79 | +6.71 | |||
| Registered voters | 230,427 | |||||
| Source: Ministry of the Interior | ||||||
Madrid

| Parties and coalitions | Popular vote | Seats | ||||
|---|---|---|---|---|---|---|
| Votes | % | ±pp | Won | +/− | ||
| People's Party (PP) | 1,625,831 | 52.52 | +3.23 | 19 | +2 | |
| Spanish Socialist Workers' Party–Progressives (PSOE–p) | 1,023,212 | 33.06 | +1.64 | 12 | +1 | |
| United Left of the Community of Madrid (IUCM) | 282,180 | 9.12 | –7.32 | 3 | –3 | |
| Independent Liberal Group (GIL) | 32,432 | 1.05 | New | 0 | ±0 | |
| Parties with less than 1.0% of the vote | 73,698 | 2.38 | — | 0 | ±0 | |
|---|---|---|---|---|---|---|
| The Greens (LV) | 24,372 | 0.79 | +0.63 | 0 | ±0 | |
| The Greens of the Community of Madrid (LVCM) | 21,087 | 0.68 | +0.43 | 0 | ±0 | |
| Centrist Union–Democratic and Social Centre (UC–CDS) | 3,557 | 0.11 | –0.26 | 0 | ±0 | |
| Communist Party of the Peoples of Spain (PCPE) | 2,836 | 0.09 | +0.04 | 0 | ±0 | |
| Party of Self-employed, Retirees and Independents (EL–PAPI) | 2,336 | 0.08 | New | 0 | ±0 | |
| Humanist Party (PH) | 2,050 | 0.07 | +0.03 | 0 | ±0 | |
| The Falange (FE) | 1,955 | 0.06 | New | 0 | ±0 | |
| Internationalist Socialist Workers' Party (POSI) | 1,757 | 0.06 | New | 0 | ±0 | |
| Party Association of Widows and Legal Wives (PAVIEL) | 1,690 | 0.05 | New | 0 | ±0 | |
| Independent Spanish Falange–Falange 2000 (FEI–FE 2000) | 1,469 | 0.05 | +0.02 | 0 | ±0 | |
| Madrilenian Independent Regional Party (PRIM) | 1,363 | 0.04 | –0.01 | 0 | ±0 | |
| Spanish Democratic Party (PADE) | 1,306 | 0.04 | New | 0 | ±0 | |
| Commoners' Land–Castilian Nationalist Party (TC–PNC) | 1,264 | 0.04 | New | 0 | ±0 | |
| Natural Law Party (PLN) | 1,263 | 0.04 | New | 0 | ±0 | |
| Party of Self-employed, Retirees and Widows (PAE) | 1,194 | 0.04 | New | 0 | ±0 | |
| Republican Action (AR) | 1,089 | 0.04 | +0.02 | 0 | ±0 | |
| Spain 2000 Platform (ES2000) | 773 | 0.02 | New | 0 | ±0 | |
| Liberal and Social Democratic Coalition (CSD–L) | 650 | 0.02 | New | 0 | ±0 | |
| Federal Progresists (PF) | 609 | 0.02 | New | 0 | ±0 | |
| Iberian Union (UNIB) | 388 | 0.01 | New | 0 | ±0 | |
| Carlist Party (PC) | 384 | 0.01 | New | 0 | ±0 | |
| Internationalist Struggle (LI (LIT–CI)) | 306 | 0.01 | New | 0 | ±0 | |
| Blank ballots | 58,114 | 1.88 | +0.62 | |||
| Total | 3,095,467 | 100.00 | 34 | ±0 | ||
| Valid votes | 3,095,467 | 99.48 | –0.20 | |||
| Invalid votes | 16,195 | 0.52 | +0.20 | |||
| Votes cast / turnout | 3,111,662 | 72.08 | –7.51 | |||
| Abstentions | 1,205,484 | 27.92 | +7.51 | |||
| Registered voters | 4,317,146 | |||||
| Source: Ministry of the Interior | ||||||
Murcia

| Parties and coalitions | Popular vote | Seats | ||||
|---|---|---|---|---|---|---|
| Votes | % | ±pp | Won | +/− | ||
| People's Party (PP) | 389,564 | 58.08 | +8.19 | 6 | +1 | |
| Spanish Socialist Workers' Party–Progressives (PSOE–p) | 217,179 | 32.38 | –5.61 | 3 | ±0 | |
| United Left (IU) | 41,842 | 6.24 | –4.29 | 0 | –1 | |
| Parties with less than 1.0% of the vote | 14,914 | 2.22 | — | 0 | ±0 | |
|---|---|---|---|---|---|---|
| The Greens of the Region of Murcia (LVRM) | 6,555 | 0.98 | New | 0 | ±0 | |
| Independent Liberal Group (GIL) | 2,362 | 0.35 | New | 0 | ±0 | |
| Spanish Democratic Party (PADE) | 1,389 | 0.21 | New | 0 | ±0 | |
| Self-employed Spanish Party (PEDA) | 1,130 | 0.17 | New | 0 | ±0 | |
| Citizens Convergence of the South-East (CCSE) | 645 | 0.10 | ±0.00 | 0 | ±0 | |
| Centrist Union–Democratic and Social Centre (UC–CDS) | 635 | 0.09 | –0.18 | 0 | ±0 | |
| The Falange (FE) | 604 | 0.09 | New | 0 | ±0 | |
| New Region (NR) | 598 | 0.09 | –0.12 | 0 | ±0 | |
| Natural Law Party (PLN) | 410 | 0.06 | New | 0 | ±0 | |
| Spain 2000 Platform (ES2000) | 383 | 0.06 | New | 0 | ±0 | |
| Catalan State (EC) | 203 | 0.03 | New | 0 | ±0 | |
| Blank ballots | 7,185 | 1.07 | +0.28 | |||
| Total | 670,684 | 100.00 | 9 | ±0 | ||
| Valid votes | 670,684 | 99.43 | –0.11 | |||
| Invalid votes | 3,832 | 0.57 | +0.11 | |||
| Votes cast / turnout | 674,516 | 73.54 | –8.46 | |||
| Abstentions | 242,701 | 26.46 | +8.46 | |||
| Registered voters | 917,217 | |||||
| Source: Ministry of the Interior | ||||||
Navarre

| Parties and coalitions | Popular vote | Seats | ||||
|---|---|---|---|---|---|---|
| Votes | % | ±pp | Won | +/− | ||
| Navarrese People's Union–People's Party (UPN–PP) | 150,995 | 49.89 | +12.77 | 3 | +1 | |
| Spanish Socialist Workers' Party–Progressives (PSOE–p) | 82,688 | 27.32 | –2.94 | 2 | ±0 | |
| United Left of Navarre (IUN/NEB) | 23,038 | 7.61 | –4.84 | 0 | –1 | |
| Basque Solidarity (EA) | 14,185 | 4.69 | +0.92 | 0 | ±0 | |
| Democrats' Convergence of Navarre (CDN) | 8,646 | 2.86 | –2.39 | 0 | ±0 | |
| Basque Nationalist Party (EAJ/PNV) | 6,536 | 2.16 | +1.19 | 0 | ±0 | |
| Parties with less than 1.0% of the vote | 4,653 | 1.54 | — | 0 | ±0 | |
|---|---|---|---|---|---|---|
| Natural Law Party (PLN) | 1,366 | 0.45 | New | 0 | ±0 | |
| Humanist Party (PH) | 970 | 0.32 | +0.03 | 0 | ±0 | |
| Carlist Party (PC) | 650 | 0.21 | New | 0 | ±0 | |
| Democratic and Social Centre–Centrist Union (CDS–UC) | 529 | 0.17 | +0.06 | 0 | ±0 | |
| The Falange (FE) | 455 | 0.15 | New | 0 | ±0 | |
| Spain 2000 Platform (ES2000) | 267 | 0.09 | New | 0 | ±0 | |
| Internationalist Struggle (LI (LIT–CI)) | 263 | 0.09 | New | 0 | ±0 | |
| Independent Spanish Falange–Falange 2000 (FEI–FE 2000) | 153 | 0.05 | New | 0 | ±0 | |
| Basque Citizens (EH)1 | 0 | 0.00 | –8.16 | 0 | ±0 | |
| Blank ballots | 11,945 | 3.95 | +2.26 | ||||||
| Total | 302,686 | 100.00 | 5 | ±0 | |||||
| Valid votes | 302,686 | 98.76 | –0.62 | ||||||
| Invalid votes | 3,808 | 1.24 | +0.62 | ||||||
| Votes cast / turnout | 306,494 | 66.07 | –7.38 | ||||||
| Abstentions | 157,398 | 33.93 | +7.38 | ||||||
| Registered voters | 463,892 | ||||||||
| Source: Ministry of the Interior | |||||||||
| |||||||||
Valencian Community
| Parties and coalitions | Popular vote | Seats | ||||
|---|---|---|---|---|---|---|
| Votes | % | ±pp | Won | +/− | ||
| People's Party (PP) | 1,267,062 | 52.11 | +8.38 | 19 | +4 | |
| Spanish Socialist Workers' Party–Progressives (PSOE–p) | 826,595 | 34.00 | –4.32 | 12 | –1 | |
| United Left of the Valencian Country (EUPV) | 141,404 | 5.82 | –5.26 | 1 | –2 | |
| Valencian Nationalist Bloc–The Greens–Valencians for Change (BNV–EV)1 | 58,551 | 2.41 | +0.58 | 0 | ±0 | |
| Valencian Union (UV) | 57,830 | 2.38 | –1.16 | 0 | –1 | |
| Parties with less than 1.0% of the vote | 50,795 | 2.09 | — | 0 | ±0 | |
|---|---|---|---|---|---|---|
| The Eco-pacifist Greens (LVEP) | 22,220 | 0.91 | New | 0 | ±0 | |
| Independent Liberal Group (GIL) | 5,444 | 0.22 | New | 0 | ±0 | |
| Communist Party of the Peoples of Spain (PCPE) | 3,149 | 0.13 | –0.02 | 0 | ±0 | |
| Front for the Valencian Country–Republican Left of Catalonia (Front–ERC) | 3,083 | 0.13 | ±0.00 | 0 | ±0 | |
| Internationalist Socialist Workers' Party (POSI) | 2,731 | 0.11 | New | 0 | ±0 | |
| Centrist Union–Democratic and Social Centre (UC–CDS) | 1,960 | 0.08 | –0.05 | 0 | ±0 | |
| Spain 2000 Platform (ES2000) | 1,516 | 0.06 | New | 0 | ±0 | |
| The Falange (FE) | 1,435 | 0.06 | New | 0 | ±0 | |
| Humanist Party (PH) | 1,385 | 0.06 | +0.02 | 0 | ±0 | |
| Spanish Democratic Party (PADE) | 1,233 | 0.05 | New | 0 | ±0 | |
| Natural Law Party (PLN) | 1,015 | 0.04 | New | 0 | ±0 | |
| Republican Action (AR) | 954 | 0.04 | +0.03 | 0 | ±0 | |
| Valencian Nationalist Left (ENV) | 920 | 0.04 | ±0.00 | 0 | ±0 | |
| Independent Spanish Falange–Falange 2000 (FEI–FE 2000) | 784 | 0.03 | New | 0 | ±0 | |
| Self-employed Spanish Party (PEDA) | 774 | 0.03 | New | 0 | ±0 | |
| Catalan State (EC) | 501 | 0.02 | New | 0 | ±0 | |
| Independent Initiative (II) | 425 | 0.02 | New | 0 | ±0 | |
| Carlist Party (PC) | 395 | 0.02 | New | 0 | ±0 | |
| New Force (FN) | 343 | 0.01 | New | 0 | ±0 | |
| Social and Autonomist Liberal Group (ALAS) | 339 | 0.01 | –0.01 | 0 | ±0 | |
| Caló Nationalist Party (PNCA) | 189 | 0.01 | New | 0 | ±0 | |
| Blank ballots | 29,198 | 1.20 | +0.40 | ||||||
| Total | 2,431,435 | 100.00 | 32 | ±0 | |||||
| Valid votes | 2,431,435 | 99.35 | –0.14 | ||||||
| Invalid votes | 15,946 | 0.65 | +0.14 | ||||||
| Votes cast / turnout | 2,447,381 | 72.70 | –8.96 | ||||||
| Abstentions | 918,829 | 27.30 | +8.96 | ||||||
| Registered voters | 3,366,210 | ||||||||
| Source: Ministry of the Interior | |||||||||
| |||||||||
Autonomous cities
Ceuta
| Parties and coalitions | Popular vote | Seats | ||||
|---|---|---|---|---|---|---|
| Votes | % | ±pp | Won | +/− | ||
| People's Party (PP) | 14,514 | 47.59 | –5.62 | 1 | ±0 | |
| Independent Liberal Group (GIL) | 8,758 | 28.71 | New | 0 | ±0 | |
| Spanish Socialist Workers' Party–Progressives (PSOE–p) | 5,491 | 18.00 | –17.79 | 0 | ±0 | |
| Socialist Party of the People of Ceuta (PSPC) | 788 | 2.58 | –4.70 | 0 | ±0 | |
| Parties with less than 1.0% of the vote | 453 | 1.49 | — | 0 | ±0 | |
|---|---|---|---|---|---|---|
| United Left (IU) | 229 | 0.75 | –1.46 | 0 | ±0 | |
| The Falange (FE) | 93 | 0.30 | New | 0 | ±0 | |
| Natural Law Party (PLN) | 76 | 0.25 | New | 0 | ±0 | |
| Democratic and Social Centre–Centrist Union (CDS–UC) | 31 | 0.10 | New | 0 | ±0 | |
| Spanish Democratic Party (PADE) | 24 | 0.08 | New | 0 | ±0 | |
| Blank ballots | 497 | 1.63 | +0.41 | |||
| Total | 30,501 | 100.00 | 1 | ±0 | ||
| Valid votes | 30,501 | 99.03 | +0.23 | |||
| Invalid votes | 300 | 0.97 | –0.23 | |||
| Votes cast / turnout | 30,801 | 55.15 | –8.66 | |||
| Abstentions | 25,047 | 44.85 | +8.66 | |||
| Registered voters | 55,848 | |||||
| Source: Ministry of the Interior | ||||||
Melilla
| Parties and coalitions | Popular vote | Seats | ||||
|---|---|---|---|---|---|---|
| Votes | % | ±pp | Won | +/− | ||
| People's Party–Melillan People's Union (PP–UPM) | 13,078 | 49.80 | –0.77 | 1 | ±0 | |
| Localist Bloc of Melilla (BLM) | 6,514 | 24.81 | New | 0 | ±0 | |
| Spanish Socialist Workers' Party–Progressives (PSOE–p) | 5,363 | 20.42 | –22.90 | 0 | ±0 | |
| United Left (IU) | 397 | 1.51 | –1.97 | 0 | ±0 | |
| Parties with less than 1.0% of the vote | 356 | 1.36 | — | 0 | ±0 | |
|---|---|---|---|---|---|---|
| The Greens–Green Group (LV–GV) | 174 | 0.66 | New | 0 | ±0 | |
| Nationalist Aprome (Aprome) | 60 | 0.23 | –0.50 | 0 | ±0 | |
| The Falange (FE) | 48 | 0.18 | New | 0 | ±0 | |
| Independent Spanish Falange–Falange 2000 (FEI–FE 2000) | 38 | 0.14 | +0.02 | 0 | ±0 | |
| Natural Law Party (PLN) | 23 | 0.09 | New | 0 | ±0 | |
| Spanish Democratic Party (PADE) | 13 | 0.05 | New | 0 | ±0 | |
| Blank ballots | 551 | 2.10 | +0.48 | |||
| Total | 26,259 | 100.00 | 1 | ±0 | ||
| Valid votes | 26,259 | 99.28 | +0.19 | |||
| Invalid votes | 191 | 0.72 | –0.19 | |||
| Votes cast / turnout | 26,450 | 54.00 | –7.95 | |||
| Abstentions | 22,535 | 46.00 | +7.95 | |||
| Registered voters | 48,985 | |||||
| Source: Ministry of the Interior | ||||||
References
- ↑ "12M/Elecciones Generales 2000" (in Spanish). Público. Retrieved 6 March 2017.
- ↑ "Effective threshold in electoral systems". Trinity College, Dublin. 30 July 2012. Retrieved 22 July 2017.
- ↑ "Representation of the people Institutional Act". juntaelectoralcentral.es. Central Electoral Commission. Retrieved 16 June 2017.
- ↑ "Constitution" (PDF). congreso.es. Congress of Deputies. Retrieved 19 June 2017.
- ↑ General Electoral System Organic Law of 1985, Organic Law No. 5 of June 19, 1985 Official State Gazette (in Spanish). Retrieved on 28 December 2016.
- ↑ Spanish Constitution of 1978, December 29, 1978 Official State Gazette (in Spanish). Retrieved on 27 December 2016.
| General elections |
|
|---|---|
| European elections | |
| Local elections | |
| Regional elections | |
| Referendums | |
| |