Oxford East (UK Parliament constituency)
| Oxford East | |
|---|---|
|
Borough constituency for the House of Commons | |
|
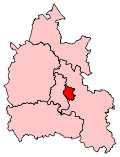
Boundary of Oxford East in Oxfordshire. | |
|
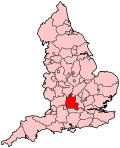
Location of Oxfordshire within England. | |
| County | Oxfordshire |
| Electorate | 81,644 (December 2010)[1] |
| Major settlements | Oxford and Cowley |
| Current constituency | |
| Created | 1983 |
| Member of parliament | Anneliese Dodds (Labour) |
| Number of members | One |
| Created from | Oxford (majority) (abolished), Mid Oxfordshire and Henley[2] |
| Overlaps | |
| European Parliament constituency | South East England |
Oxford East is a constituency[n 1] represented in the House of Commons of the UK Parliament by Anneliese Dodds of the Labour Party.[n 2]

The constituency covers the eastern and southern parts of Oxford in Oxfordshire. It borders Oxford West and Abingdon to the West and Henley to the North, East and South.
The constituency includes Oxford city centre and the majority of the Oxford colleges, Cowley (famous for its car factory) and the Blackbird Leys council estate, but it contains a large percentage of students from Oxford and Oxford Brookes universities (the latter being based in the seat, in leafy suburban Headington). At the end of 2010 unemployment claimant count was 2.3%, 45th of the 84 South East constituencies and close to the mean of 2.45%.[3]
History
Until 1983, the whole of Oxford, including most of this seat, was part of the Oxford constituency.
For the first four years Oxford East was served by Conservative Steven Norris. He was defeated by Labour candidate Andrew Smith, who held the seat for the next 30 years. The Conservative share of the vote fell to 18.8% in 2010. The seat became a Labour–Liberal Democrat marginal in 2005, as Smith came within a thousand votes of losing the seat.
In 2015 the second-placed candidate became a Conservative. The 2015 result made the seat the 80th-safest of Labour's 232 seats by percentage of majority.[4] Five of nine parties' candidates achieved more than deposit-retaining threshold of 5% of the vote in 2015. Smith retired at the 2017 election, and was succeeded by Anneliese Dodds, who won by 23,284 votes (43.2%), the biggest margin of victory for any candidate in Oxford East's history, and the largest margin for any Oxford MP in a contested election since before the First World War.
Conservative ex-MP Norris won the largest runner-up share of the vote to date, in the 1987 election – 40.4% of the vote. Turnout has ranged between 78.9% in 1987 and 55.8% in 2001.
Boundaries
- 1983–1997
- The City of Oxford wards of Blackbird Leys, East, Headington, Iffley, Marston, Quarry, St Clement's, Temple Cowley, and Wood Farm, and the District of South Oxfordshire wards of Littlemore, Marston, and Risinghurst.
- 1997–2010
- The City of Oxford wards of Blackbird Leys, East, Headington, Iffley, Littlemore, Marston, Old Marston and Risinghurst, Quarry, St Clement's, South, Temple Cowley, and Wood Farm. The 1997 boundary changes moved two semi-rural Conservative-leaning wards out of the seat, and incorporated the urban Oxford South ward that was strong for the Liberal Democrats and Labour.
- Since 2010
- The City of Oxford wards of Barton and Sandhills, Blackbird Leys, Carfax, Churchill, Cowley, Cowley Marsh, Headington, Headington Hill and Northway, Hinksey Park, Holywell, Iffley Fields, Littlemore, Lye Valley, Marston, Northfield Brook, Quarry and Risinghurst, Rose Hill and Iffley, St Clement's, and St Mary's. Parliament accepted the Boundary Commission's Fifth Periodic Review of Westminster constituencies which slightly altered this constituency for the General Election 2010. These changes added Carfax and Holywell wards from Oxford West and Abingdon. This means that Oxford city centre and the majority of Oxford colleges now sit in Oxford East, whereas they had previously sat in Oxford West and Abingdon for the most part. It was expected that this would benefit the Liberal Democrats in this marginal constituency. However, when the seat was contested on new boundaries the Labour incumbent Andrew Smith managed to quadruple his majority on various pro-Labour two-party swings defying the vast majority of those nationally.[n 3]
Members of Parliament
| Election | Member[5] | Party | |
|---|---|---|---|
| 1983 | Steve Norris | Conservative | |
| 1987 | Andrew Smith | Labour | |
| 1992 | |||
| 1997 | |||
| 2001 | |||
| 2005 | |||
| 2010 | |||
| 2015 | |||
| 2017 | Anneliese Dodds | Labour | |
Elections
Elections in the 2010s
| Party | Candidate | Votes | % | ± | |
|---|---|---|---|---|---|
| Labour | Anneliese Dodds[8] | 35,118 | 65.2 | | |
| Conservative | Suzanne Bartington[9] | 11,834 | 22.0 | | |
| Liberal Democrat | Kirsten Johnson[10] | 4,904 | 9.1 | | |
| Green | Larry Sanders[11] | 1,785 | 3.3 | | |
| Independent | Chaka Artwell | 255 | 0.5 | | |
| Majority | 23,284 | 43.2 | | ||
| Turnout | 53,896 | 68.8 | | ||
| Labour hold | Swing | |
|||
| Party | Candidate | Votes | % | ± | |
|---|---|---|---|---|---|
| Labour | Andrew Smith | 25,356 | 50.0 | +7.5 | |
| Conservative | Melanie Magee | 10,076 | 19.9 | +1.0 | |
| Green | Ann Duncan[13] | 5,890 | 11.6 | +9.2 | |
| Liberal Democrat | Alasdair Murray[14] | 5,453 | 10.8 | -22.8 | |
| UKIP | Ian Macdonald[15] | 3,451 | 6.8 | +4.5 | |
| Independent | Chaka Artwell[16] | 160 | 0.3 | +0.3 | |
| Monster Raving Loony | Mad Hatter[16] | 145 | 0.3 | +0.3 | |
| TUSC | James Morbin[17] | 108 | 0.2 | +0.2 | |
| Socialist (GB) | Kevin Parkin[18] | 50 | 0.1 | +0.1 | |
| Majority | 15,280 | 30.1 | |||
| Turnout | 50,689 | 64.2[19] | |||
| Labour hold | Swing | ||||

| Party | Candidate | Votes | % | ± | |
|---|---|---|---|---|---|
| Labour | Andrew Smith | 21,938 | 42.47 | +6.5 | |
| Liberal Democrat | Steve Goddard | 17,357 | 33.6 | −1.6 | |
| Conservative | Ed Argar | 9,727 | 18.8 | +1.5 | |
| Green | Sushila Dhall[21] | 1,238 | 2.4 | −2.1 | |
| UKIP | Julia Gasper | 1,202 | 2.3 | +0.6 | |
| Socialist Equality | David O'Sullivan | 116 | 0.2 | N/A | |
| Equal Parenting Alliance | Roger Crawford | 73 | 0.1 | N/A | |
| Majority | 4,581 | 8.9 | |||
| Turnout | 51,651 | 63.1 | +5.6 | ||
| Labour hold | Swing | +2.45 | |||
Elections in the 2000s
| Party | Candidate | Votes | % | ± | |
|---|---|---|---|---|---|
| Labour | Andrew Smith | 15,405 | 36.9 | −12.5 | |
| Liberal Democrat | Steve Goddard | 14,442 | 34.6 | +11.2 | |
| Conservative | Virginia Morris | 6,992 | 16.7 | −2.0 | |
| Green | Jacob Sanders | 1,813 | 4.3 | +0.5 | |
| Independent ('New Loony') | Honest Blair | 1,485 | 3.6 | N/A | |
| Independent Working Class | Maurice Leen | 892 | 2.1 | N/A | |
| UKIP | Peter Gardner | 715 | 1.7 | +0.3 | |
| Independent | Pathmanathan Mylvaganam | 46 | 0.1 | −0.1 | |
| Majority | 963 | 2.3 | |||
| Turnout | 41,790 | 57.9 | +2.1 | ||
| Labour hold | Swing | −11.8 | |||
| Party | Candidate | Votes | % | ± | |
|---|---|---|---|---|---|
| Labour | Andrew Smith | 19,681 | 49.4 | −7.4 | |
| Liberal Democrat | Steve Goddard | 9,337 | 23.4 | +8.7 | |
| Conservative | Cheryl Potter | 7,446 | 18.7 | −3.3 | |
| Green | Pritam Singh | 1,501 | 3.8 | +1.7 | |
| Socialist Alliance | John Lister | 708 | 1.8 | N/A | |
| UKIP | Peter Gardner | 570 | 1.4 | +0.9 | |
| Socialist Labour | Fahim Ahmed | 274 | 0.7 | N/A | |
| ProLife Alliance | Linda Hodge | 254 | 0.6 | −0.1 | |
| Independent | Pathmanathan Mylvaganam | 77 | 0.2 | 0.0 | |
| Majority | 10,344 | 26.0 | |||
| Turnout | 39,848 | 55.8 | −12.6 | ||
| Labour hold | Swing | ||||
Elections in the 1990s
| Party | Candidate | Votes | % | ± | |
|---|---|---|---|---|---|
| Labour | Andrew Smith | 27,205 | 56.8 | +6.6 | |
| Conservative | Jonathan Djanogly | 10,540 | 22.0 | −11.5 | |
| Liberal Democrat | George Kershaw | 7,038 | 14.7 | +0.7 | |
| Referendum | John Young | 1,391 | 2.9 | N/A | |
| Green | Craig Simmons | 975 | 2.0 | +0.0 | |
| ProLife Alliance | William Harper-Jones | 318 | 0.7 | N/A | |
| UKIP | Peter Gardner | 234 | 0.5 | N/A | |
| Natural Law | John Thompson | 108 | 0.2 | N/A | |
| Independent Anti-majority Democracy | Pathmanathan Mylvaganam | 68 | 0.2 | N/A | |
| Majority | 16,665 | 34.8 | +18.1 | ||
| Turnout | 47,877 | 68.4 | |||
| Labour hold | Swing | +9.1 | |||
| Party | Candidate | Votes | % | ± | |
|---|---|---|---|---|---|
| Labour | Andrew Smith | 23,702 | 50.4 | +7.4 | |
| Conservative | Mark Mayall | 16,164 | 34.3 | −6.1 | |
| Liberal Democrat | Martin Horwood | 6,105 | 13.0 | −2.6 | |
| Green | Caroline Lucas | 933 | 2.0 | +1.1 | |
| Natural Law | Ann Wilson | 101 | 0.2 | N/A | |
| Revolutionary Communist | Keith Thompson | 48 | 0.1 | N/A | |
| Majority | 7,538 | 16.1 | +13.5 | ||
| Turnout | 47,053 | 74.6 | −4.3 | ||
| Labour hold | Swing | +6.8 | |||
Elections in the 1980s
| Party | Candidate | Votes | % | ± | |
|---|---|---|---|---|---|
| Labour | Andrew Smith | 21,103 | 43.0 | +5.7 | |
| Conservative | Steven Norris | 19,815 | 40.4 | +0.4 | |
| Liberal | Margaret Godden | 7,648 | 15.6 | −7.1 | |
| Green | Dave Dalton | 441 | 0.9 | N/A | |
| Independent | Pathmanathan Mylvaganam | 60 | 0.1 | N/A | |
| Majority | 1,288 | 2.6 | −0.1 | ||
| Turnout | 49,067 | 78.9 | +5.0 | ||
| Labour gain from Conservative | Swing | +2.7 | |||
| Party | Candidate | Votes | % | ± | |
|---|---|---|---|---|---|
| Conservative | Steven Norris | 18,808 | 40.0 | N/A | |
| Labour | Andrew Smith | 17,541 | 37.3 | N/A | |
| Liberal | Margaret Godden | 10,690 | 22.7 | N/A | |
| Majority | 1,267 | 2.7 | N/A | ||
| Turnout | 47,039 | 73.9 | N/A | ||
| Conservative win (new seat) | |||||
Neighbouring constituencies
Constituencies bordering Oxford East | |||||||||||||||||
|---|---|---|---|---|---|---|---|---|---|---|---|---|---|---|---|---|---|
 |
| | |||||||||||||||
See also
Notes and references
- Notes
- ↑ A borough constituency (for the purposes of election expenses and type of returning officer)
- ↑ As with all constituencies, the constituency elects one Member of Parliament (MP) by the first past the post system of election at least every five years.
- ↑ In 2008 on the constituency's previous boundaries Labour candidates won in local government elections 11 of the wards, Lib Dems: 4, Greens: 3 and an Independent Working Class Association candidate won the remaining ward seat.
- References
- ↑ "Electorate Figures". 2011 Electorate Figures. Boundary Commission for England. 4 March 2011. Retrieved 13 March 2011.
- ↑ "'Oxford East', June 1983 up to May 1997". ElectionWeb Project. Cognitive Computing Limited. Retrieved 13 March 2016.
- ↑ Unemployment claimants by constituency The Guardian
- ↑ List of Labour MPs elected in 2015 by % majority UK Political.info. Retrieved 29 January 2017
- ↑ Leigh Rayment's Historical List of MPs – Constituencies beginning with "O"
- ↑ "GENERAL ELECTION: List of Oxfordshire parliamentary candidates published". The Oxford Times.
- ↑ "South Live: Thursday 11 May". BBC News.
- ↑ "Parliamentary candidate announced to replace Labour's Andrew Smith". Oxford Mail. Retrieved 27 April 2017.
- ↑ "Conservatives reveal Dr Suzanne Bartington as candidate for Oxford East". Oxford Mail. Retrieved 7 May 2017.
- ↑ "Dr Kirsten Johnson". Liberal Democrats.
- ↑ "Larry Sanders pledges to tackle inequality if he becomes Oxford East MP". Oxford Mail.
- ↑ "Election Data 2015". Electoral Calculus. Archived from the original on 17 October 2015. Retrieved 17 October 2015.
- ↑ "Ann Duncan". Oxfordshire Green Party.
- ↑ McKenzie, Conor (2 March 2015). "Alasdair Murray to Take the Fight to Labour". Oxford East Lib Dems. Retrieved 3 March 2015.
- ↑ "UK Polling Report".
- 1 2 Collie, Jason. "Oxford East candidates – who you can vote for". Oxford Mail. Newsquest. Retrieved 10 April 2015.
- ↑ "TUSC parliamentary candidates in May 2015" (PDF). TUSC. 4 February 2015.
- ↑ "General Election – Campaign News". Socialist Party of Great Britain. 15 January 2015.
- ↑ total electorate 78978: email from Oxford City
- ↑ "Election Data 2010". Electoral Calculus. Archived from the original on 17 October 2015. Retrieved 17 October 2015.
- ↑ Oxfordshire Green Party news release, 4 February 2010. Peter Tatchell was the prospective parliamentary candidate for the Green Party until withdrawing in December 2009 for health reasons.
- ↑ "Election Data 2005". Electoral Calculus. Archived from the original on 15 October 2011. Retrieved 18 October 2015.
- ↑ "Election Data 2001". Electoral Calculus. Archived from the original on 15 October 2011. Retrieved 18 October 2015.
- ↑ "Election Data 1997". Electoral Calculus. Archived from the original on 15 October 2011. Retrieved 18 October 2015.
- ↑ "Politics Resources". Election 1997. Politics Resources. 1 May 1997. Retrieved 7 January 2011.
- ↑ Rallings, C; Thrasher, M (1995). The Media Guide to the New Parliamentary Constituencies. Plymouth: LGC Elections Centre. p. 131.
- ↑ The 1997 election result is calculated relative to the notional, not the actual, 1992 result.
- ↑ "Election Data 1992". Electoral Calculus. Archived from the original on 15 October 2011. Retrieved 18 October 2015.
- ↑ "Politics Resources". Election 1992. Politics Resources. 9 April 1992. Retrieved 6 December 2010.
- ↑ This was an unusual election, in which an incumbent was challenged by two people who later became MPs.
- ↑ "Election Data 1987". Electoral Calculus. Archived from the original on 15 October 2011. Retrieved 18 October 2015.
- ↑ "Election Data 1983". Electoral Calculus. Archived from the original on 15 October 2011. Retrieved 18 October 2015.
Sources
- Election result 2015
- Election result, 2015 (BBC)
- Election result, 2010 (BBC)
- Election result, 2005 (BBC)
- Election results, 1997–2001 (BBC)
- Election results, 1997–2001 (Election Demon)
- Election results, 1983–1992 (Election Demon)
The City of Oxford | ||
|---|---|---|
| Wards, suburbs, neighbourhoods and districts |
|  |
| Civil parishes | ||
| Former district and borough | ||
| Former constituencies | ||
Coordinates: 51°45′N 1°12′W / 51.75°N 1.20°W