Nottingham South (UK Parliament constituency)
| Nottingham South | |
|---|---|
|
Borough constituency for the House of Commons | |
|
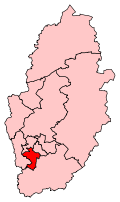
Boundary of Nottingham South in Nottinghamshire. | |
|
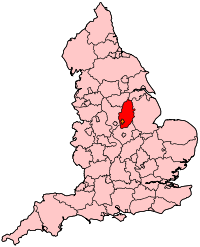
Location of Nottinghamshire within England. | |
| County | Nottinghamshire |
| Electorate | 69,154 (December 2010)[1] |
| Current constituency | |
| Created | 1983 |
| Member of parliament | Lillian Greenwood (Labour) |
| Number of members | One |
| Created from | Nottingham East and Nottingham West |
| 1885–1974 | |
| Number of members | One |
| Type of constituency | Borough constituency |
| Replaced by |
Nottingham East, Nottingham West, Rushcliffe |
| Created from | Nottingham |
| Overlaps | |
| European Parliament constituency | East Midlands |
Nottingham South is a constituency[n 1]. [n 2]
Members of Parliament
The seat was represented by Lilian Greenwood in the last parliament, who succeeded Labour's Alan Simpson on his retirement. Simpson had held the seat since 1992, when he unseated the Conservative Martin Brandon-Bravo.
MPs since 1983
| Election | Member[2] | Party | |
|---|---|---|---|
| 2010 | Lilian Greenwood | Labour | |
| 1992 | Alan John Simpson | Labour | |
| 1983 | Martin Brandon-Bravo | Conservative | |
MPs 1885–1974
Constituency profile
The seat is the most economically diverse of the three Nottingham constituencies covering higher income and lower income output areas (sub-divisions of wards).[3] This has led to it becoming the most marginal of the seats, changing hands on several occasions over the past few decades and has below-national levels of unemployment claimants, for example at the end of 2010 male claimants were less than half as many as in Nottingham North.[4]
The constituency is also the most politically diverse of the three city seats which together form Nottingham City Council. In the 2007 elections for Nottingham City Council, the constituency elected 9 of the 42 Labour councillors, 6 of the 7 Conservatives and 5 of the 6 Liberal Democrats.[5]
Boundaries
Nottingham South contains at least parts of both of the city's universities. The University of Nottingham's University Park Campus and Jubilee Campus are both in the constituency, as is the Clifton Campus of Nottingham Trent University.
The constituency borders several other seats in Nottingham city and the surrounding area. It is surrounded to the South and East by Rushcliffe constituency, which is represented by Kenneth Clarke. To the West, it borders Broxtowe and both Nottingham North and Nottingham East to the North.
Roughly, the constituency covers the southern part of the City of Nottingham in Nottinghamshire.
2010–present: The City of Nottingham wards of Bridge, Clifton North, Clifton South, Dunkirk and Lenton, Leen Valley, Radford and Park, Wollaton East and Lenton Abbey, and Wollaton West.
1983-2010: The City of Nottingham wards of Abbey, Bridge, Clifton East, Clifton West, Lenton, Park, Robin Hood, Wilford, and Wollaton.
1955-1974: The County Borough of Nottingham wards of Bridge, Clifton, Lenton, and Trent, and the Urban District of West Bridgford.
1918-1955: The County Borough of Nottingham wards of Bridge, Castle, Meadows, and Trent.
1885-1918: The Borough of Nottingham wards of Castle, Market, Meadow, St Mary Bridge, and Trent.
History
Since as early as 1295, Nottingham was represented by one large constituency which elected two members of parliament to the House of Commons. Under a major Act of 1885 three single-member subdivisions were created: Nottingham East, Nottingham West and Nottingham South.
- Nine year absence of the seat
Nottingham South was abolished in the election of February 1974 but was re-formed with altered boundaries nine years later in 1983 from parts of Nottingham East and Nottingham West.
- Modern demography
Nottingham South is the most diverse of the three constituencies in terms of economic demographics. It includes areas of higher incomes than average in the form of Wollaton and The Park Estate[3] and areas of relative poverty, both suburban and inner city. The council estate built next to and within the bounds of the village/parish of Clifton was once the largest in Europe.
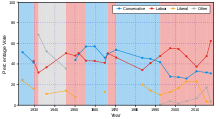
Results to date excluding under the Blair Ministry when it was quite firmly Labour have produced the most marginal majorities of Nottingham City's three constituencies. The Conservative Martin Brandon-Bravo held the seat from 1983–92. Between 1992-2017, Nottingham South was held by Labour MPs; Alan Simpson until retiring from the House of Commons in 2010 and Lilian Greenwood from 2010.

Communities or localities in Nottingham South include:
- Clifton
- Dunkirk
- Hockley Village
- Lace Market
- Leen Valley
- Lenton Abbey
- Lenton
- Parts of Nottingham City Centre
- Radford
- The Meadows
- The Park Estate
- Wollaton
Elections

Elections in the 2010s
| Party | Candidate | Votes | % | ± | |
|---|---|---|---|---|---|
| Labour | Lilian Greenwood | 30,013 | 62.4 | | |
| Conservative | Jane Hunt | 14,851 | 30.9 | | |
| Liberal Democrat | Tony Sutton | 1,564 | 3.2 | | |
| UKIP | David Hollas | 1,103 | 2.3 | | |
| Green | Adam McGregor | 598 | 1.2 | | |
| Majority | 15,162 | 31.5 | | ||
| Turnout | 48,129 | 67.6 | | ||
| Labour hold | Swing | |
|||
| Party | Candidate | Votes | % | ± | |
|---|---|---|---|---|---|
| Labour | Lilian Greenwood[8] | 20,697 | 47.6 | | |
| Conservative | Jane Hunt[9] | 13,761 | 31.7 | | |
| UKIP | David Hollas[10] | 4,900 | 11.3 | | |
| Green | Adam McGregor[11] | 2,345 | 5.4 | | |
| Liberal Democrat | Deborah Newton-Cook[12] | 1,532 | 3.5 | | |
| TUSC | Andrew Clayworth | 230 | 0.5 | | |
| Majority | 6,936 | 16.0 | |||
| Turnout | 43,465 | 63.0 | | ||
| Labour hold | Swing | 5.8 | |||

From left to right:
Tony Sutton (Liberal Democrats), Rowena Holland (Conservative Party), Ken Browne (UK Independence Party), Matthew Butcher (Green Party), Lilian Greenwood (Labour Party)
| Party | Candidate | Votes | % | ± | |
|---|---|---|---|---|---|
| Labour | Lillian Greenwood | 15,209 | 37.3 | | |
| Conservative | Rowena Holland | 13,437 | 32.9 | | |
| Liberal Democrat | Tony Sutton | 9,406 | 23.1 | | |
| BNP | Tony Woodward | 1,140 | 2.8 | N/A | |
| UKIP | Ken Browne | 967 | 2.4 | | |
| Green | Matthew Butcher | 630 | 1.5 | N/A | |
| Majority | 1,772 | 4.4 | | ||
| Turnout | 40,789 | 60.5 | | ||
| Labour hold | Swing | |
|||
Elections in the 2000s
| Party | Candidate | Votes | % | ± | |
|---|---|---|---|---|---|
| Labour | Alan Simpson | 16,506 | 47.4 | | |
| Conservative | Sudesh Mattu | 9,020 | 25.9 | | |
| Liberal Democrat | Tony Sutton | 7,961 | 22.9 | | |
| UKIP | Ken Browne | 1,353 | 3.9 | | |
| Majority | 7,486 | 21.5 | |||
| Turnout | 34,840 | 50.6 | | ||
| Labour hold | Swing | |
|||
| Party | Candidate | Votes | % | ± | |
|---|---|---|---|---|---|
| Labour | Alan Simpson | 19,949 | 54.5 | | |
| Conservative | Wendy Manning | 9,960 | 27.2 | | |
| Liberal Democrat | Kevin Mulloy | 6,064 | 16.6 | | |
| UKIP | David Bartrop | 632 | 1.7 | N/A | |
| Majority | 9,989 | 27.3 | |||
| Turnout | 36,605 | 50.1 | | ||
| Labour hold | Swing | ||||
Elections in the 1990s
| Party | Candidate | Votes | % | ± | |
|---|---|---|---|---|---|
| Labour | Alan Simpson | 26,825 | 55.3 | | |
| Conservative | Brian Kirsch | 13,461 | 27.7 | | |
| Liberal Democrat | Gary Long | 6,265 | 12.9 | | |
| Referendum | Ken Thompson | 1,523 | 3.1 | N/A | |
| National Democrats | Sharron Edwards | 446 | 0.9 | N/A | |
| Majority | 13,364 | 27.6 | |||
| Turnout | 48,520 | 67.0 | |||
| Labour hold | Swing | 10.8 | |||
| Party | Candidate | Votes | % | ± | |
|---|---|---|---|---|---|
| Labour | Alan Simpson | 25,771 | 47.7 | | |
| Conservative | Martin Brandon-Bravo | 22,590 | 41.8 | | |
| Liberal Democrat | Gareth Long | 5,408 | 10.0 | | |
| Natural Law | Julianne Christou | 263 | 0.5 | N/A | |
| Majority | 3,181 | 5.9 | | ||
| Turnout | 54,032 | 74.2 | | ||
| Labour gain from Conservative | Swing | |
|||
Elections in the 1980s
| Party | Candidate | Votes | % | ± | |
|---|---|---|---|---|---|
| Conservative | Martin Brandon-Bravo | 23,921 | 45.0 | | |
| Labour | Alan Simpson | 21,687 | 40.8 | | |
| Social Democratic | Leighton Williams | 7,517 | 14.2 | | |
| Majority | 2,234 | 4.2 | |||
| Turnout | 53,125 | 73.0 | |||
| Conservative hold | Swing | ||||
| Party | Candidate | Votes | % | ± | |
|---|---|---|---|---|---|
| Conservative | Martin Brandon-Bravo | 22,238 | 45.9 | N/A | |
| Labour | Ken Coates | 16,523 | 34.1 | N/A | |
| Liberal | Raymond Poynter | 9,697 | 20.0 | N/A | |
| Majority | 5,715 | 11.8 | N/A | ||
| Turnout | 48,458 | 70.2 | N/A | ||
| Conservative win (new seat) | |||||
Elections in the 1970s
| Party | Candidate | Votes | % | ± | |
|---|---|---|---|---|---|
| Conservative | Norman Fowler | 26,726 | 53.75 | ||
| Labour | George Perry | 23,031 | 46.25 | ||
| Majority | 3,731 | 7.49 | |||
| Turnout | 49,793 | 70.03 | |||
| Conservative gain from Labour | Swing | ||||
Elections in the 1960s
| Party | Candidate | Votes | % | ± | |
|---|---|---|---|---|---|
| Labour | George Perry | 24,580 | 50.32 | ||
| Conservative | William Clark | 24,268 | 49.68 | ||
| Majority | 316 | 0.65 | |||
| Turnout | 48,848 | 75.61 | |||
| Labour gain from Conservative | Swing | ||||
| Party | Candidate | Votes | % | ± | |
|---|---|---|---|---|---|
| Conservative | William Clark | 23,594 | 45.97 | ||
| Labour | William Frederick Back | 21,046 | 41.00 | ||
| Liberal | Brian S Stratford | 6,690 | 13.03 | ||
| Majority | 2,548 | 4.96 | |||
| Turnout | 51,329 | 78.17 | |||
| Conservative hold | Swing | ||||
Elections in the 1950s
| Party | Candidate | Votes | % | ± | |
|---|---|---|---|---|---|
| Conservative | William Clark | 29,607 | 57.11 | ||
| Labour | John Silkin | 22,235 | 42.89 | ||
| Majority | 7,372 | 14.22 | |||
| Turnout | 51,845 | 72.49 | |||
| Conservative hold | Swing | ||||
| Party | Candidate | Votes | % | ± | |
|---|---|---|---|---|---|
| Conservative | Denis Keegan | 29,145 | 56.88 | ||
| Labour Co-op | Norman Smith | 22,092 | 43.12 | ||
| Majority | 7,053 | 13.77 | |||
| Turnout | 51,240 | 78.29 | |||
| Conservative gain from Labour Co-op | Swing | ||||
| Party | Candidate | Votes | % | ± | |
|---|---|---|---|---|---|
| Labour Co-op | Norman Smith | 19,844 | 50.61 | ||
| Conservative | William Rees-Davies | 19,362 | 49.39 | ||
| Majority | 482 | 1.23 | |||
| Turnout | 84.47 | ||||
| Labour Co-op hold | Swing | ||||
| Party | Candidate | Votes | % | ± | |
|---|---|---|---|---|---|
| Labour Co-op | Norman Smith | 18,806 | 48.03 | ||
| Conservative | William Rees-Davies | 17,165 | 43.82 | ||
| Liberal | EG Watkins | 3,182 | 8.13 | ||
| Majority | 1,641 | 4.19 | |||
| Turnout | 85.37 | ||||
| Labour Co-op hold | Swing | ||||
Elections in the 1940s
| Party | Candidate | Votes | % | ± | |
|---|---|---|---|---|---|
| Labour Co-op | Norman Smith | 15,316 | 50.46 | ||
| National | Frank Markham | 10,766 | 35.47 | ||
| Liberal | Richard James Blindell | 4,272 | 14.07 | ||
| Majority | 4,550 | 14.99 | |||
| Turnout | 75.91 | ||||
| Labour Co-op gain from National Labour | Swing | ||||
Elections in the 1930s
| Party | Candidate | Votes | % | ± | |
|---|---|---|---|---|---|
| National Labour | Frank Markham | 15,559 | 52.24 | ||
| Labour | TJ May | 10,963 | 36.81 | ||
| Liberal | Joseph Mawdesley | 3,260 | 10.95 | ||
| Majority | 4,596 | 15.43 | |||
| Turnout | 70.95 | ||||
| National Labour hold | Swing | ||||
| Party | Candidate | Votes | % | ± | |
|---|---|---|---|---|---|
| National Labour | Holford Knight | 22,852 | 68.35 | ||
| Labour | Alonza Randolph Ellis | 10,583 | 31.65 | ||
| Majority | 12,269 | 36.70 | |||
| Turnout | 77.57 | ||||
| National Labour hold | Swing | ||||
Elections in the 1920s
| Party | Candidate | Votes | % | ± | |
|---|---|---|---|---|---|
| Labour | Holford Knight | 14,800 | 42.9 | ||
| Unionist | Henry Cavendish-Bentinck | 14,252 | 41.3 | ||
| Liberal | Leslie Hale | 5,445 | 15.8 | ||
| Majority | 548 | 1.6 | |||
| Turnout | |||||
| Labour gain from Unionist | Swing | ||||
| Party | Candidate | Votes | % | ± | |
|---|---|---|---|---|---|
| Unionist | Henry Cavendish-Bentinck | 10,724 | 51.4 | ||
| Independent Labour | Henry Mills | 5,176 | 24.8 | ||
| Liberal | Victor Deidorichs Duval | 4,966 | 23.8 | ||
| Majority | 5,548 | 26.6 | |||
| Turnout | 67.6 | ||||
| Unionist hold | Swing | ||||
See also
Notes and references
- Notes
- ↑ A county constituency (for the purposes of election expenses and type of returning officer)
- ↑ As with all constituencies, the constituency elects one Member of Parliament (MP) by the first past the post system of election at least every five years.
- References
- ↑ "Electorate Figures – Boundary Commission for England". 2011 Electorate Figures. Boundary Commission for England. 4 March 2011. Retrieved 13 March 2011.
- 1 2 Leigh Rayment's Historical List of MPs – Constituencies beginning with "N" (part 3)
- 1 2 "2001 Census". The Office for National Statistics. Retrieved 28 December 2014.
- ↑ Simon Rogers, John Burn-Murdoch and Ami Sedghi (15 May 2013). "Unemployment: the key UK data and benefit claimants for every constituency". The Guardian. Retrieved 28 December 2014.
- ↑ "Local Election Results May 2007". Nottingham City Council. Archived from the original on 15 June 2011. Retrieved 28 December 2014.
- ↑ "Statement of persons nominated, notice of poll and situation of polling stations" (PDF). Nottingham City Council. 11 May 2017. Retrieved 8 June 2017.
- ↑ "Election Data 2015". Electoral Calculus. Archived from the original on 17 October 2015. Retrieved 17 October 2015.
- ↑ "About Lilian Greenwood MP". Labour Party. Retrieved 28 December 2014.
- ↑ "Jane Hunt: Candidate for Nottingham South". Conservative Party. Retrieved 28 December 2014.
- ↑ "Candidate: David Hollas MBE". UK Independence Party. Retrieved 28 December 2014.
- ↑ "Adam McGregor: Candidate for Nottingham South".
- ↑ "Candidate: Deborah Newton-Cook".
- ↑ "Election Data 2010". Electoral Calculus. Archived from the original on 26 July 2013. Retrieved 17 October 2015.
- ↑ "Election Data 2005". Electoral Calculus. Archived from the original on 15 October 2011. Retrieved 18 October 2015.
- ↑ "Election Data 2001". Electoral Calculus. Archived from the original on 15 October 2011. Retrieved 18 October 2015.
- ↑ "Election Data 1997". Electoral Calculus. Archived from the original on 15 October 2011. Retrieved 18 October 2015.
- ↑ "Election Data 1992". Electoral Calculus. Archived from the original on 15 October 2011. Retrieved 18 October 2015.
- ↑ "UK General Election results April 1992". Politics Resources. Retrieved 28 December 2014.
- ↑ "Election Data 1987". Electoral Calculus. Archived from the original on 15 October 2011. Retrieved 18 October 2015.
- ↑ "Election Data 1983". Electoral Calculus. Archived from the original on 15 October 2011. Retrieved 18 October 2015.
- ↑ The Times' Guide to the House of Commons. 1955.
- ↑ The Times' Guide to the House of Commons. 1951.
- ↑ The Times' Guide to the House of Commons. 1950.
- ↑ The Times' Guide to the House of Commons. 1945.
- 1 2 British Parliamentary Election Results 1918-1949, FWS Craig
Coordinates: 52°55′N 1°10′W / 52.92°N 1.17°W

