New York's 10th congressional district
| New York's 10th congressional district | |
|---|---|
|
New York's 10th congressional district - since January 3, 2013. | |
| Current Representative | Jerrold Nadler (D–Manhattan) |
| Cook PVI | D+26[1] |
New York's 10th Congressional District is a congressional district for the United States House of Representatives formerly located from 2003 to 2013 in Brooklyn, New York City, currently represented by Democrat Jerrold Nadler. The district contains the southern portion of Morningside Heights, the Upper West Side of Manhattan, the west side of Midtown Manhattan, the west side of Lower Manhattan including Greenwich Village and the Financial District and parts of Brooklyn, including Borough Park.
With a size of 14.25 mi², this is currently the second smallest congressional district in the whole country.[2] Demographically, it includes neighborhoods of Manhattan and Brooklyn that are heavily Jewish.
From 2003-2013, the district was located entirely within Brooklyn and was majority African-American. It included the neighborhoods of Bedford-Stuyvesant, Brooklyn Heights, Brownsville, Canarsie, East New York and Ocean Hill, as well as parts of Fort Greene, Prospect Heights and Williamsburg.
Redistricting
The 10th District was a Brooklyn-based seat prior to 1972, when that district became the 16th and the 10th District was reassigned to a district in northern Queens and the east Bronx. The 1980 redistricting restored the 10th District to Brooklyn (covering the same terrain). In the 1990 remap, much of the old 10th District was added to the new Queens-Brooklyn 9th District. The new 10th then absorbed much of the old 11th District, including its congressman.
Following the 2012 redistricting cycle, the district shed most of its Brooklyn territory and picked up parts of Manhattan that had been in the 8th district.
Voting
|
| ||||||||||||||||||||||||||||||||||||
List of representatives
| Representative | Party | Years | Electoral history | Geography |
|---|---|---|---|---|
| District created | 1793 | |||
 Silas Talbot Silas Talbot |
Pro- Administration |
March 4, 1793 – June 5, 1794 |
Resigned to join the U.S. Navy | Western New York with its eastern border being approximately the eastern borders of Jefferson (with St. Lawrence County), Lewis (with St. Lawrence County), Herkimer (its northern border), Hamilton (northern and eastern), Fulton, Montgomery, Schoharie, and Delaware Counties. With Delaware County its southern border was also one of the district borders. |
| Vacant | June 5, 1794 – March 3, 1795 |
No special election called by Gov. Clinton for political reasons | ||
 William Cooper William Cooper |
Federalist | March 4, 1795 – March 3, 1797 |
[Data unknown/missing. You can help!] | |
 James Cochran James Cochran |
Federalist | March 4, 1797 – March 3, 1799 |
[Data unknown/missing. You can help!] | |
 William Cooper William Cooper |
Federalist | March 4, 1799 – March 3, 1801 |
[Data unknown/missing. You can help!] | All New York west of and including Cayuga, Onondaga, Cortland, and Broome Counties. It also included portions of what is today Chenango and Otsego Counties. |
 Thomas Morris Thomas Morris |
Federalist | March 4, 1801 – March 3, 1803 |
[Data unknown/missing. You can help!] | |
 George Tibbits George Tibbits |
Federalist | March 4, 1803 – March 3, 1805 |
[Data unknown/missing. You can help!] | Rensselaer County |
 Josiah Masters Josiah Masters |
Democratic- Republican |
March 4, 1805 – March 3, 1809 |
[Data unknown/missing. You can help!] | |
 John Nicholson John Nicholson |
Democratic- Republican |
March 4, 1809 – March 3, 1811 |
[Data unknown/missing. You can help!] | Jefferson, Lewis, Herkimer and St. Lawrence Counties. |
 Silas Stow Silas Stow |
Democratic- Republican |
March 4, 1811 – March 3, 1813 |
[Data unknown/missing. You can help!] | |
 Hosea Moffitt Hosea Moffitt |
Federalist | March 4, 1813 – March 3, 1817 |
[Data unknown/missing. You can help!] | Rensselaer County |
 John P. Cushman John P. Cushman |
Federalist | March 4, 1817 – March 3, 1819 |
[Data unknown/missing. You can help!] | |
 John D. Dickinson John D. Dickinson |
Federalist | March 4, 1819 – March 3, 1823 |
[Data unknown/missing. You can help!] | |
 Stephen Van Rensselaer Stephen Van Rensselaer |
Adams-Clay Federalist |
March 4, 1823 – March 3, 1825 |
Redistricted from the 9th district | Albany County |
| Adams | March 4, 1825 – March 3, 1829 | |||
 Ambrose Spencer Ambrose Spencer |
Anti-Jacksonian | March 4, 1829 – March 3, 1831 |
[Data unknown/missing. You can help!] | |
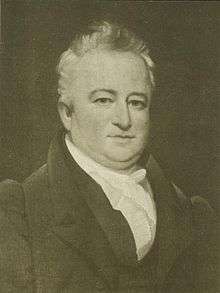 Gerrit Y. Lansing Gerrit Y. Lansing |
Jacksonian | March 4, 1831 – March 3, 1837 |
[Data unknown/missing. You can help!] | |
 Albert Gallup Albert Gallup |
Democratic | March 4, 1837 – March 3, 1839 |
[Data unknown/missing. You can help!] | |
 Daniel D. Barnard Daniel D. Barnard |
Whig | March 4, 1839 – March 3, 1843 |
Redistricted to the 13th district | |
 Jeremiah Russell Jeremiah Russell |
Democratic | March 4, 1843 – March 3, 1845 |
[Data unknown/missing. You can help!] | Delaware and Ulster Counties. |
.jpg) Samuel Gordon Samuel Gordon |
Democratic | March 4, 1845 – March 3, 1847 |
[Data unknown/missing. You can help!] | |
 Eliakim Sherrill Eliakim Sherrill |
Whig | March 4, 1847 – March 3, 1849 |
[Data unknown/missing. You can help!] | |
 Herman D. Gould Herman D. Gould |
Whig | March 4, 1849 – March 3, 1851 |
[Data unknown/missing. You can help!] | |
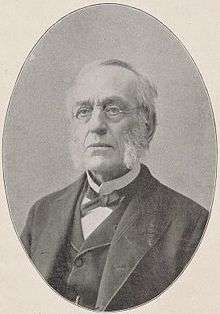 Marius Schoonmaker Marius Schoonmaker |
Whig | March 4, 1851 – March 3, 1853 |
[Data unknown/missing. You can help!] | |
 William Murray William Murray |
Independent Democratic |
March 4, 1853 – March 3, 1855 |
Redistricted from the 9th district | Sullivan and Orange Counties. |
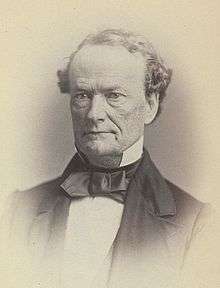 Ambrose S. Murray Ambrose S. Murray |
Opposition | March 4, 1855 – March 3, 1857 |
[Data unknown/missing. You can help!] | |
| Republican | March 4, 1857 – March 3, 1859 | |||
 Charles Van Wyck Charles Van Wyck |
Republican | March 4, 1859 – March 3, 1863 |
[Data unknown/missing. You can help!] | |
 William Radford William Radford |
Democratic | March 4, 1863 – March 3, 1867 |
[Data unknown/missing. You can help!] | Westchester and Rockland Counties and The Bronx. |
 William H. Robertson William H. Robertson |
Republican | March 4, 1867 – March 3, 1869 |
[Data unknown/missing. You can help!] | |
 Clarkson Nott Potter Clarkson Nott Potter |
Democratic | March 4, 1869 – March 3, 1873 |
Redistricted to the 11th district | |
 Fernando Wood Fernando Wood |
Democratic | March 4, 1873 – March 3, 1875 |
Redistricted from the 9th district Redistricted to the 9th district |
Northern Manhattan. |
 Abram Stevens Hewitt Abram Stevens Hewitt |
Democratic | March 4, 1875 – March 3, 1879 |
[Data unknown/missing. You can help!] | Various parts of mid-town and Lower Manhattan. |
 James O'Brien James O'Brien |
Independent Democratic |
March 4, 1879 – March 3, 1881 |
[Data unknown/missing. You can help!] | |
 Abram Stevens Hewitt Abram Stevens Hewitt |
Democratic | March 4, 1881 – December 30, 1886 |
Resigned on election as Mayor of New York City | |
| Vacant | December 30, 1886 – March 4, 1887 | |||
 Francis B. Spinola Francis B. Spinola |
Democratic | March 4, 1887 – April 14, 1891 |
Died | |
| Vacant | April 14, 1891 – November 3, 1891 | |||
.jpg) William Bourke Cockran William Bourke Cockran |
Democratic | November 3, 1891 – March 3, 1893 |
Redistricted to the 12th district | |
 Daniel E. Sickles Daniel E. Sickles |
Democratic | March 4, 1893 – March 3, 1895 |
Lost re-election | |
| Vacant | March 4, 1895 – November 5, 1895 |
Representative-elect Andrew J. Campbell died before term began | ||
 Amos J. Cummings Amos J. Cummings |
Democratic | November 5, 1895 – May 2, 1902 |
Elected to finish Campbells' term Re-elected in 1896 Re-elected in 1898 Re-elected in 1900 Died | |
| Vacant | May 2, 1902 – November 4, 1902 | |||
 Edward Swann Edward Swann |
Democratic | November 4, 1902 – March 3, 1903 |
[Data unknown/missing. You can help!] | |
 William Sulzer William Sulzer |
Democratic | March 4, 1903 – December 31, 1912 |
Redistricted from the 11th district Resigned to become Governor of New York | |
| Vacant | January 1, 1913 – March 4, 1913 | |||
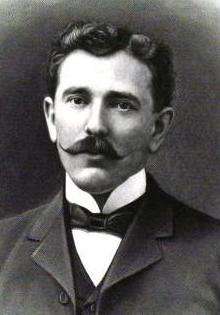 Herman A. Metz Herman A. Metz |
Democratic | March 4, 1913 – March 3, 1915 |
[Data unknown/missing. You can help!] | Parts of Brooklyn |
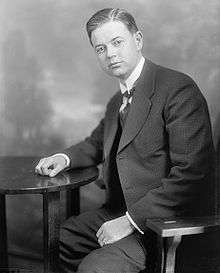 Reuben L. Haskell Reuben L. Haskell |
Republican | March 4, 1915 – December 31, 1919 |
Re-elected in 1916 Re-elected in 1918 | |
| Vacant | December 31, 1919 – November 2, 1920 | |||
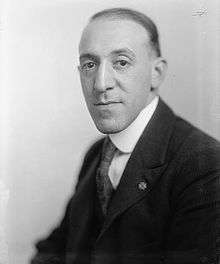 Lester D. Volk Lester D. Volk |
Republican | November 2, 1920 – March 3, 1923 |
Elected to finish Haskell's term Lost re-election in 1922 | |
 Emanuel Celler Emanuel Celler |
Democratic | March 4, 1923 – January 3, 1945 |
Redistricted to the 15th district | |
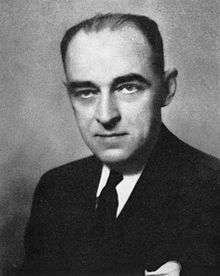 Andrew L. Somers Andrew L. Somers |
Democratic | January 3, 1945 – April 6, 1949 |
Redistricted from the 6th district Died | |
| Vacant | April 7, 1949 – November 7, 1949 | |||
 Edna F. Kelly Edna F. Kelly |
Democratic | November 8, 1949 – January 3, 1963 |
Elected to finish Somers's term Re-elected in 1950 Re-elected in 1952 Re-elected in 1954 Re-elected in 1956 Re-elected in 1958 Re-elected in 1960 Redistricted to the 12th district and won re-election there | |
 Emanuel Celler Emanuel Celler |
Democratic | January 3, 1963 – January 3, 1971 |
Redistricted from the 11th district and re-elected in 1962 Re-elected in 1964 Re-elected in 1966 Re-elected in 1968 Re-elected in 1970 Redistricted to the 16th district and lost renomination there |
Parts of Brooklyn, Queens |
| January 3, 1971 – January 3, 1973 |
Parts of Brooklyn | |||
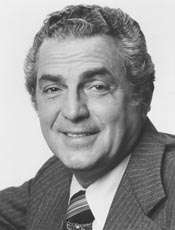 Mario Biaggi Mario Biaggi |
Democratic | January 3, 1973 – January 3, 1983 |
Redistricted from the 24th district and re-elected in 1972 Re-elected in 1974 Re-elected in 1976 Re-elected in 1978 Re-elected in 1980 Redistricted to the 19th district and won re-election there |
Parts of Bronx, Queens |
 Chuck Schumer Chuck Schumer |
Democratic | January 3, 1983 – January 3, 1993 |
Redistricted from the 16th district and re-elected in 1982 Re-elected in 1984 Re-elected in 1986 Re-elected in 1988 Re-elected in 1990 Redistricted to the 9th district and won re-election there |
Parts of Brooklyn |
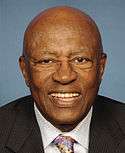 Ed Towns Ed Towns |
Democratic | January 3, 1993 – January 3, 2013 |
Redistricted from the 11th district and re-elected in 1992 Re-elected in 1994 Re-elected in 1996 Re-elected in 1998 Re-elected in 2000 Re-elected in 2002 Re-elected in 2004 Re-elected in 2006 Re-elected in 2008 Re-elected in 2010 Retired | |
 Jerrold Nadler Jerrold Nadler |
Democratic | January 3, 2013 – | Redistricted from the 8th district and elected here in 2012 Re-elected in 2014 |
Parts of Manhattan and Brooklyn |
Election results
In New York State, there are numerous minor parties at various points on the political spectrum. Certain parties will invariably endorse either the Republican or Democratic candidate for every office, hence the state electoral results contain both the party votes, and the final candidate votes (Listed as "Recap").
| Party | Candidate | Votes | % | ± | |
|---|---|---|---|---|---|
| Democratic | Clarkson Nott Potter | 14,249 | 57.1 | ||
| Republican | James Westervelt | 10,685 | 42.9 | ||
| Majority | 3,564 | 14.2 | |||
| Turnout | 24,934 | 100 | |||
| Party | Candidate | Votes | % | ± | |
|---|---|---|---|---|---|
| Democratic | Edolphus Towns | 99,889 | 91.3 | ||
| Republican | Amelia Smith-Parker | 8,660 | 7.9 | ||
| Right to Life | Julian M. Hill, Jr. | 893 | 0.8 | ||
| Majority | 91,229 | 83.4 | |||
| Turnout | 109,442 | 100 | |||
| Party | Candidate | Votes | % | ± | |
|---|---|---|---|---|---|
| Democratic | Edolphus Towns | 83,528 | 92.3 | | |
| Republican | Ernestine M. Brown | 5,577 | 6.2 | | |
| Conservative | Ernest Johnson | 1,396 | 1.5 | | |
| Majority | 77,951 | 86.1 | | ||
| Turnout | 90,501 | 100 | | ||
| Party | Candidate | Votes | % | ± | |
|---|---|---|---|---|---|
| Democratic | Edolphus Towns | 120,700 | 90.2 | | |
| Republican | Ernestine M. Brown | 6,852 | 5.1 | | |
| Working Families | Barry Ford | 5,530 | 4.1 | | |
| Conservative | Ernest Johnson | 802 | 0.6 | | |
| Majority | 113,848 | 85.0 | | ||
| Turnout | 133,884 | 100 | | ||
| Party | Candidate | Votes | % | ± | |
|---|---|---|---|---|---|
| Democratic | Edolphus Towns | 73,859 | 97.8 | | |
| Conservative | Herbert F. Rayn | 1,639 | 2.2 | | |
| Majority | 72,220 | 95.7 | | ||
| Turnout | 75,498 | 100 | | ||
| Party | Candidate | Votes | % | ± | |
|---|---|---|---|---|---|
| Democratic | Edolphus Towns | 136,113 | 91.5 | | |
| Republican | Harvey R. Clarke | 11,099 | 7.5 | | |
| Conservative | Mariana Blume | 1,554 | 1.0 | | |
| Majority | 125,014 | 84.0 | | ||
| Turnout | 148,766 | 100 | | ||
| Party | Candidate | Votes | % | ± | |
|---|---|---|---|---|---|
| Democratic | Edolphus Towns | 72,171 | 92.2 | | |
| Republican | Jonathan H. Anderson | 4,666 | 6.0 | | |
| Conservative | Ernest Johnson | 1,470 | 1.9 | | |
| Majority | 67,505 | 86.2 | | ||
| Turnout | 78,307 | 100 | | ||
| Party | Candidate | Votes | % | ± | |
|---|---|---|---|---|---|
| Democratic | Edolphus Towns | 72,171 | 92.2 | | |
| Republican | Jonathan H. Anderson | 4,666 | 6.0 | | |
| Conservative | Ernest Johnson | 1,470 | 1.9 | | |
| Majority | 67,505 | 86.2 | | ||
| Turnout | 78,307 | 100 | | ||
| Party | Candidate | Votes | % | ± | |
|---|---|---|---|---|---|
| Democratic | Jerrold Nadler | 89,080 | 87.6 | n/a | |
| Conservative | Ross Brady | 12,042 | 11.8 | n/a | |
| Flourish Every Person | Michael Dilger | 554 | 0.6 | n/a | |
| Majority | 89,080 | 75.8 | n/a | ||
| Turnout | 113,226 | 20.1 | n/a | ||
| Party | Candidate | Votes | % | ± | |
|---|---|---|---|---|---|
| Democratic | Jerrold Nadler | 25,527 | 89.6 | n/a | |
| Democratic | Oliver Rosenberg | 2,949 | 10.4 | n/a | |
| Majority | 22,578 | 79.3 | n/a | ||
| Turnout | 28,476 | 5.1 | n/a | ||
| Party | Candidate | Votes | % | ± | |
|---|---|---|---|---|---|
| Democratic | Jerrold Nadler | 170,286 | 77.5 | n/a | |
| Republican | Philip Rosenthal | 49,530 | 22.5 | n/a | |
| Majority | 120,756 | 55 | n/a | ||
| Turnout | 219,816 | 39.4 | n/a | ||
Historical district boundaries

See also
- List of United States congressional districts
- New York's congressional districts
- United States congressional delegations from New York
Notes
- ↑ "Partisan Voting Index – Districts of the 115th Congress" (PDF). The Cook Political Report. April 7, 2017. Retrieved April 7, 2017.
- ↑ "New York congressional districts by urban and rural population and land area". United States Census Bureau. Retrieved December 11, 2014.
- ↑ November Election, 1870. Complete Statement of the Official Canvass, in Detail of the Election Held November 8, 1870, Giving the Vote of Each Election District, with Proceedings of County And State... Volume II. County of New York. 1871. p. 2031. Retrieved 2009-03-13.
- ↑ "Politico - New York House Races Results". Retrieved 13 July 2016.
- ↑ "New York U.S. House 10th District Results: Jerrold Nadler Wins - Election Results 2016 - The New York Times". Retrieved 24 February 2017.
References
- Martis, Kenneth C. (1989). The Historical Atlas of Political Parties in the United States Congress. New York: Macmillan Publishing Company.
- Martis, Kenneth C. (1982). The Historical Atlas of United States Congressional Districts. New York: Macmillan Publishing Company.
- Congressional Biographical Directory of the United States 1774–present
- 2006 House election data Clerk of the House of Representatives
- 2004 House election data "
- 2002 House election data "
- 2000 House election data "
- 1998 House election data "
- 1996 House election data "
Coordinates: 40°42′07″N 74°00′26″W / 40.70194°N 74.00722°W
.tif.png)