Biomass (ecology)

Biomass, is the mass of living biological organisms in a given area or ecosystem at a given time. Biomass can refer to species biomass, which is the mass of one or more species, or to community biomass, which is the mass of all species in the community. It can include microorganisms, plants or animals.[4] The mass can be expressed as the average mass per unit area, or as the total mass in the community.
How biomass is measured depends on why it is being measured. Sometimes, the biomass is regarded as the natural mass of organisms in situ, just as they are. For example, in a salmon fishery, the salmon biomass might be regarded as the total wet weight the salmon would have if they were taken out of the water. In other contexts, biomass can be measured in terms of the dried organic mass, so perhaps only 30% of the actual weight might count, the rest being water. For other purposes, only biological tissues count, and teeth, bones and shells are excluded. In some applications, biomass is measured as the mass of organically bound carbon (C) that is present.
Apart from bacteria, the total live biomass on Earth is about 560 billion tonnes C,[1] and the total annual primary production of biomass is just over 100 billion tonnes C/yr.[5] The total live biomass of bacteria may be as much as that of plants and animals[6] or may be much less.[7] The total amount of DNA base pairs on Earth, as a possible approximation of global biodiversity, is estimated at 5.0 x 1037, and weighs 50 billion tonnes.[8] In comparison, the total mass of the biosphere has been estimated to be as much as 4 TtC (trillion tons of carbon).[9]
Ecological pyramids

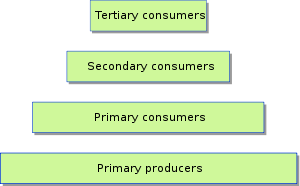
An ecological pyramid is a graphical representation that shows, for a given ecosystem, the relationship between biomass or biological productivity and trophic levels.
- A biomass pyramid shows the amount of biomass at each trophic level.
- A productivity pyramid shows the production or turn-over in biomass at each trophic level.
An ecological pyramid provides a snapshot in time of an ecological community.
The bottom of the pyramid represents the primary producers (autotrophs). The primary producers take energy from the environment in the form of sunlight or inorganic chemicals and use it to create energy-rich molecules such as carbohydrates. This mechanism is called primary production. The pyramid then proceeds through the various trophic levels to the apex predators at the top.
When energy is transferred from one trophic level to the next, typically only ten percent is used to build new biomass. The remaining ninety percent goes to metabolic processes or is dissipated as heat. This energy loss means that productivity pyramids are never inverted, and generally limits food chains to about six levels. However, in oceans, biomass pyramids can be wholly or partially inverted, with more biomass at higher levels.
Terrestrial biomass
Terrestrial biomass generally decreases markedly at each higher trophic level (plants, herbivores, carnivores). Examples of terrestrial producers are grasses, trees and shrubs. These have a much higher biomass than the animals that consume them, such as deer, zebras and insects. The level with the least biomass are the highest predators in the food chain, such as foxes and eagles.
In a temperate grassland, grasses and other plants are the primary producers at the bottom of the pyramid. Then come the primary consumers, such as grasshoppers, voles and bison, followed by the secondary consumers, shrews, hawks and small cats. Finally the tertiary consumers, large cats and wolves. The biomass pyramid decreases markedly at each higher level.
Ocean biomass
The marine food chain
![]() predatory fish
predatory fish
↑
![]() filter feeders
filter feeders
↑
predatory zooplankton
↑
zooplankton
↑
phytoplankton
Ocean or marine biomass, in a reversal of terrestrial biomass, can increase at higher trophic levels. In the ocean, the food chain typically starts with phytoplankton, and follows the course:
Phytoplankton → zooplankton → predatory zooplankton → filter feeders → predatory fish
Phytoplankton are the main primary producers at the bottom of the marine food chain. Phytoplankton use photosynthesis to convert inorganic carbon into protoplasm. They are then consumed by microscopic animals called zooplankton.
Zooplankton comprise the second level in the food chain, and includes small crustaceans, such as copepods and krill, and the larva of fish, squid, lobsters and crabs.
In turn, small zooplankton are consumed by both larger predatory zooplankters, such as krill, and by forage fish, which are small, schooling, filter-feeding fish. This makes up the third level in the food chain.

The fourth trophic level consists of predatory fish, marine mammals and seabirds that consume forage fish. Examples are swordfish, seals and gannets.
Apex predators, such as orcas, which can consume seals, and shortfin mako sharks, which can consume swordfish, make up the fifth trophic level. Baleen whales can consume zooplankton and krill directly, leading to a food chain with only three or four trophic levels.
Marine environments can have inverted biomass pyramids. In particular, the biomass of consumers (copepods, krill, shrimp, forage fish) is larger than the biomass of primary producers. This happens because the ocean's primary producers are tiny phytoplankton that grow and reproduce rapidly, so a small mass can have a fast rate of primary production. In contrast, terrestrial primary producers grow and reproduce slowly.
There is an exception with cyanobacteria. Marine cyanobacteria are the smallest known photosynthetic organisms; the smallest of all, Prochlorococcus, is just 0.5 to 0.8 micrometres across.[10] Prochlorococcus is possibly the most plentiful species on Earth: a single millilitre of surface seawater may contain 100,000 cells or more. Worldwide, there are estimated to be several octillion (~1027) individuals.[11] Prochlorococcus is ubiquitous between 40°N and 40°S and dominates in the oligotrophic (nutrient poor) regions of the oceans.[12] The bacterium accounts for an estimated 20% of the oxygen in the Earth's atmosphere, and forms part of the base of the ocean food chain.[13]
Bacterial biomass
There are typically 50 million bacterial cells in a gram of soil and a million bacterial cells in a millilitre of fresh water. In a much-cited study from 1998[6] the world bacterial biomass was calculated to be 350 to 550 billions of tonnes of carbon, equal to between 60% and 100% of the carbon in plants. More recent studies of seafloor microbes have cast considerable doubt on that, one study in 2012[7] reduced the calculated microbial biomass on the seafloor from the original 303 billions of tonnes of C to just 4.1 billions of tonnes of C, reducing the global biomass of prokaryotes to 50 to 250 billions of tonnes of C. Further, if the average per cell biomass of prokaryotes is reduced from 86 to 14 femtograms C[7] then the global biomass of prokaryotes is reduced to 13 to 44.5 billions of tonnes of C, equal to between 2.4% and 8.1% of the carbon in plants.
| Geographic location | Number of cells (×1029) | Billions of tonnes of carbon |
|---|---|---|
| Ocean floor |
||
| Open ocean |
1.2[6] |
|
| Terrestrial soil |
2.6[6] |
|
| Subsurface terrestrial |
2.5 to 25[6] |
Global biomass
Estimates for the global biomass of species and higher level groups are not always consistent across the literature. Apart from bacteria, the total global biomass has been estimated at about 560 billion tonnes C.[1] Most of this biomass is found on land, with only 5 to 10 billion tonnes C found in the oceans.[1] On land, there is about 1,000 times more plant biomass (phytomass) than animal biomass (zoomass). About 18% of this plant biomass is eaten by the land animals.[15] However, in the ocean, the animal biomass is nearly 30 times larger than the plant biomass.[16] Most ocean plant biomass is eaten by the ocean animals.[15]
| name | number of species | date of estimate | individual count | mean living mass of individual | percent biomass (dried) | total number of carbon atoms | global dry biomass in million tonnes | global wet (fresh) biomass in million tonnes | |
|---|---|---|---|---|---|---|---|---|---|
| Terrestrial | 1 |
2012[17] |
7.0 billion |
50 kg (incl children) |
30% |
3.5 x 1026 [18] |
105 |
350 | |
| 2005 |
4.63 billion |
287[19] | |||||||
| 1 |
1.3 billion[20] |
400 kg |
30% |
156 |
520 | ||||
| 2 |
2002 |
1.75 billion[21] |
60 kg |
30% |
31.5 |
105 | |||
| 1 |
24 billion |
2 kg |
30% |
14.4 |
48 | ||||
| 12,649[22] |
107 - 108 billion [23] |
3 x 10⁻⁶ kg (0.003 grams) |
30% |
10–100 |
30-300 | ||||
| >7,000 |
1881 Darwin |
1.3 x 10 6 billion [24] |
3 g |
30% [25] |
1,140-2,280[24] |
3,800-7,600[24] | |||
| >2,800 |
1996 |
445[26] | |||||||
| Marine |
1 |
Pre-whaling |
340,000 |
40%[28] |
36 | ||||
| 2001 |
4,700 |
40%[28] |
0.5 | ||||||
| >10,000 |
2009 |
800-2,000[29] | |||||||
| 1 |
1924–2004 |
7.8 x 10¹⁴ |
0.486 g |
379[30] | |||||
| 13,000 |
10−6 - 10−9 kg |
1x1037 [31] |
|||||||
| ? |
2003 |
1,000[32] | |||||||
| Global | Prokaryotes (bacteria) |
? |
1998 |
4–6 x 1030 cells[6] |
1.76-2.76 x 1040 [6] |
350,000-550,000[6] |
Humans comprise about 100 million tonnes of the Earth's dry biomass,[33] domesticated animals about 700 million tonnes, earthworms over 1,100 million tonnes,[24] and annual cereal crops about 2.3 billion tonnes.[34]
The most successful animal species, in terms of biomass, may well be Antarctic krill, Euphausia superba, with a fresh biomass approaching 500 million tonnes,[30][35][36] although domestic cattle may also reach these immense figures. However, as a group, the small aquatic crustaceans called copepods may form the largest animal biomass on earth.[37] A 2009 paper in Science estimates, for the first time, the total world fish biomass as somewhere between 0.8 and 2.0 billion tonnes.[38][39] It has been estimated that about 1% of the global biomass is due to phytoplankton,[40] and 25% is due to fungi.[41][42]
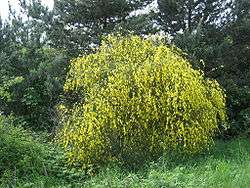
 Grasses, trees and shrubs have a much higher biomass than the animals that consume them
 The total biomass of bacteria may equal that of plants.[6]
.jpg) Antarctic krill form one of the largest biomasses of any individual animal species.[35]
Antarctic krill form one of the largest biomasses of any individual animal species.[35] It has been claimed that fungi make up 25% of the global biomass
Global rate of production

Net primary production is the rate at which new biomass is generated, mainly due to photosynthesis. Global primary production can be estimated from satellite observations. Satellites scan the normalised difference vegetation index (NDVI) over terrestrial habitats, and scan sea-surface chlorophyll levels over oceans. This results in 56.4 billion tonnes C/yr (53.8%), for terrestrial primary production, and 48.5 billion tonnes C/yr for oceanic primary production.[5] Thus, the total photoautotrophic primary production for the Earth is about 104.9 billion tonnes C/yr. This translates to about 426 gC/m²/yr for land production (excluding areas with permanent ice cover), and 140 gC/m²/yr for the oceans.
However, there is a much more significant difference in standing stocks—while accounting for almost half of total annual production, oceanic autotrophs account for only about 0.2% of the total biomass. Autotrophs may have the highest global proportion of biomass, but they are closely rivaled or surpassed by microbes.[43][44]
Terrestrial freshwater ecosystems generate about 1.5% of the global net primary production.[45]
Some global producers of biomass in order of productivity rates are
| Producer | Biomass productivity (gC/m²/yr) |
Ref | Total area (million km²) |
Ref | Total production (billion tonnes C/yr) |
|---|---|---|---|---|---|
| Swamps and Marshes | 2,500 | [3] | |||
| Tropical rainforests | 2,000 | [46] | 8 | 16 | |
| Coral reefs | 2,000 | [3] | 0.28 | [47] | 0.56 |
| Algal beds | 2,000 | [3] | |||
| River estuaries | 1,800 | [3] | |||
| Temperate forests | 1,250 | [3] | 19 | 24 | |
| Cultivated lands | 650 | [3][48] | 17 | 11 | |
| Tundras | 140 | [3][48] | |||
| Open ocean | 125 | [3][48] | 311 | 39 | |
| Deserts | 3 | [48] | 50 | 0.15 |
See also
- Biomass (as in bioproducts)
- Natural organic matter
- Productivity (ecology)
- Primary nutritional groups
- Standing stock
- Lake Pohjalampi - a biomass manipulation study
- List of harvested aquatic animals by weight
References
- 1 2 3 4 Groombridge B, Jenkins MD (2000) Global biodiversity: Earth’s living resources in the 21st century Page 11. World Conservation Monitoring Centre, World Conservation Press, Cambridge
- ↑ "Biomass". Archived from the original on 14 June 2010.
- 1 2 3 4 5 6 7 8 9 Ricklefs, Robert E.; Miller, Gary Leon (2000). Ecology (4th ed.). Macmillan. p. 192. ISBN 978-0-7167-2829-0.
- ↑ IUPAC, Compendium of Chemical Terminology, 2nd ed. (the "Gold Book") (1997). Online corrected version: (2006–) "biomass".
- 1 2 Field, C.B.; Behrenfeld, M.J.; Randerson, J.T.; Falkowski, P. (1998). "Primary production of the Biosphere: Integrating Terrestrial and Oceanic Components". Science. 281 (5374): 237–240. Bibcode:1998Sci...281..237F. PMID 9657713. doi:10.1126/science.281.5374.237.
- 1 2 3 4 5 6 7 8 9 10 11 12 13 14 15 16 Whitman WB, Coleman DC, Wiebe WJ (1998). "Prokaryotes: the unseen majority" (PDF). Proceedings of the National Academy of Sciences of the United States of America. 95 (12): 6578–83. Bibcode:1998PNAS...95.6578W. PMC 33863
 . PMID 9618454. doi:10.1073/pnas.95.12.6578.
 - 1 2 3 4 5 6 7 8 Kallmeyer J; et al. (2012). "Global distribution of microbial abundance and biomass in subseafloor sediment". Proceedings of the National Academy of Sciences of the United States of America. 109 (40): 16213–6. PMC 3479597
 . PMID 22927371. doi:10.1073/pnas.1203849109.
 - ↑ Nuwer, Rachel (18 July 2015). "Counting All the DNA on Earth". The New York Times. New York: The New York Times Company. ISSN 0362-4331. Retrieved 2015-07-18.
- ↑ "The Biosphere: Diversity of Life". Aspen Global Change Institute. Basalt, CO. Retrieved 2015-07-19.
- ↑ Kettler, Gregory C.; Martiny, Adam C.; Huang, Katherine; Zucker, Jeremy; Coleman, Maureen L.; Rodrigue, Sebastien; Chen, Feng; Lapidus, Alla; et al. (December 2007). "Patterns and Implications of Gene Gain and Loss in the Evolution of Prochlorococcus". PLoS Genetics. 3 (12): e231. PMC 2151091
 . PMID 18159947. doi:10.1371/journal.pgen.0030231.
 - ↑ Nemiroff, R.; Bonnell, J., eds. (27 September 2006). "Earth from Saturn". Astronomy Picture of the Day. NASA.
- ↑ F. Partensky, W. R. Hess & D. Vaulot (1999). "Prochlorococcus, a marine photosynthetic prokaryote of global significance". Microbiology and Molecular Biology Reviews. 63 (1): 106–127. PMC 98958
 . PMID 10066832.
 - ↑ The Most Important Microbe You've Never Heard Of
- ↑ Lipp JS, Morono Y, Inagaki F, Hinrichs KU (2008). "Significant contribution of Archaea to extant biomass in marine subsurface sediments". Nature. 454: 991–994. PMID 18641632. doi:10.1038/nature07174.
- 1 2 Hartley, Sue (2010) The 300 Million Years War: Plant Biomass v Herbivores Royal Institution Christmas Lecture.
- ↑ Darlington, P (1966) http://encyclopedia2.thefreedictionary.com/Terrestrial+Fauna "Biogeografia". Published in The Great Soviet Encyclopedia, 3rd Edition (1970-1979).
- ↑ US world population clock Archived 1 July 2009 at the Wayback Machine.
- ↑ Freitas, Robert A. Jr.Nanomedicine 3.1 Human Body Chemical Composition Foresight Institute, 1998
- 1 2 Walpole, S.C.; Prieto-Merino, D.; Edwards, P.; Cleland, J.; Stevens, G.; Roberts, I. (2012). "The weight of nations: an estimation of adult human biomass" (PDF). BMC Public Health. 12 (1): 439. PMC 3408371
 . PMID 22709383. doi:10.1186/1471-2458-12-439.
 - ↑ Cattle Today. "Breeds of Cattle at CATTLE TODAY". Cattle-today.com. Retrieved 2013-10-15.
- ↑ World's Rangelands Deteriorating Under Mounting Pressure Archived 11 March 2008 at the Wayback Machine. Earth Policy Institute 2002
- ↑ http://osuc.biosci.ohio-state.edu/hymenoptera/tsa.sppcount?the_taxon=Formicidae
- ↑ Embery, Joan and Lucaire, Ed (1983) Collection of Amazing Animal Facts.
- 1 2 3 4 Blakemore R. J. (2017) Darwin’s win-win for Global Worming?
- ↑ Lee, K.E. (1985: 33) Earthworms - their Ecology and Relationships with Soils and Land Use. Academic Press.
- ↑ Sum of [(biomass m^-2)*(area m^2)] from table 3 in Sanderson, M.G. 1996 Biomass of termites and their emissions of methane and carbon dioxide: A global database Global Biochemical Cycles, Vol 10:4 543-557
- ↑ Pershing, A.J.; Christensen, L.B.; Record, N.R.; Sherwood, G.D.; Stetson, P.B.; Humphries, Stuart (2010). Humphries, Stuart, ed. "The Impact of Whaling on the Ocean Carbon Cycle: Why Bigger Was Better". PLoS ONE. 5 (8): e12444. Bibcode:2010PLoSO...512444P. PMC 2928761
 . PMID 20865156. doi:10.1371/journal.pone.0012444. (Table 1)
 - 1 2 Jelmert, A.; Oppen-Berntsen, D.O. (1996). "Whaling and Deep-Sea Biodiversity". Conservation Biology. 10 (2): 653–654. doi:10.1046/j.1523-1739.1996.10020653.x.
- ↑ Wilson RW, Millero FJ, Taylor JR, Walsh PJ, Christensen V, Jennings S and Grosell M (2009) "Contribution of Fish to the Marine Inorganic Carbon Cycle" Science, 323 (5912) 359-362. (This article provides a first estimate of global fish "wet weight" biomass)
- 1 2 Atkinson, A.; Siegel, V.; Pakhomov, E.A.; Jessopp, M.J.; Loeb, V. (2009). "A re-appraisal of the total biomass and annual production of Antarctic krill" (PDF). Deep-Sea Research Part I. 56 (5): 727–740. Bibcode:2009DSRI...56..727A. doi:10.1016/j.dsr.2008.12.007.
- ↑ Buitenhuis, E. T.; Quéré, C. Le; Aumont, O.; Beaugrand, G.; Bunker, A.; Hirst, A.; Ikeda, T.; O'Brien, T.; Piontkovski, S.; Straile, D. (2006). "Biogeochemical fluxes through mesozooplankton". Global Biogeochemical Cycles. 20: 2003. Bibcode:2006GBioC..20.2003B. doi:10.1029/2005GB002511.
- ↑ Garcia-Pichel, F; Belnap, J; Neuer, S; Schanz, F (2003). "Estimates of global cyanobacterial biomass and its distribution" (PDF). Algological Studies. 109: 213–217. doi:10.1127/1864-1318/2003/0109-0213.
- ↑ The world human population was 6.6 billion in January 2008. At an average weight of 100 pounds (30 lbs of biomass), that equals 100 million tonnes.
- ↑ FAO Statistical Yearbook 2013: page 130 - http://www.fao.org/docrep/018/i3107e/i3107e.PDF
- 1 2 Nicol, S.; Endo, Y. (1997). Fisheries Technical Paper 367: Krill Fisheries of the World. FAO.
- ↑ Ross, R. M. and Quetin, L. B. (1988). Euphausia superba: a critical review of annual production. Comp. Biochem. Physiol. 90B, 499-505.
- 1 2 Biology of Copepods Archived 1 January 2009 at the Wayback Machine. at Carl von Ossietzky University of Oldenburg
- ↑ Wilson, RW; Millero, FJ; Taylor, JR; Walsh, PJ; Christensen, V; Jennings, S; Grosell, M (2009). "Contribution of Fish to the Marine Inorganic Carbon Cycle". Science. 323 (5912): 359–362. Bibcode:2009Sci...323..359W. PMID 19150840. doi:10.1126/science.1157972.
- ↑ Researcher gives first-ever estimate of worldwide fish biomass and impact on climate change PhysOrg.com, 15 January 2009.
- ↑ Bidle1, KD; Falkowski, PG (2004). "Cell death in planktonic, photosynthetic microorganisms". Nature Reviews Microbiology. 2 (8): 643–655. doi:10.1038/nrmicro956.
- ↑ Miller, JD (1992). "Fungi as contaminants in indoor air". Atmospheric Environment. 26 (12): 2163–2172. Bibcode:1992AtmEn..26.2163M. doi:10.1016/0960-1686(92)90404-9.
- ↑ Sorenson, WG (1999). "Fungal spores: Hazardous to health?" (PDF). Environ Health Perspect. 107 (Suppl 3): 469–472. PMC 1566211
 . PMID 10423389. doi:10.1289/ehp.99107s3469.
 - ↑ Whitman, W. B.; Coleman, D. C.; Wieb, W. J. (1998). "Prokaryotes: The unseen majority" (PDF). Proc. Natl. Acad. Sci. USA. 95 (12): 6578–6583. Bibcode:1998PNAS...95.6578W. PMC 33863
 . PMID 9618454. doi:10.1073/pnas.95.12.6578.
 - ↑ Groombridge, B.; Jenkins, M. (2002). World Atlas of Biodiversity: Earth's Living Resources in the 21st Century. World Conservation Monitoring Centre, United Nations Environment Programme. ISBN 0-520-23668-8. PMC 3408371
 .
. - ↑ Alexander, David E. (1 May 1999). Encyclopedia of Environmental Science. Springer. ISBN 0-412-74050-8.
- ↑ Ricklefs, Robert E.; Miller, Gary Leon (2000). Ecology (4th ed.). Macmillan. p. 197. ISBN 978-0-7167-2829-0.
- ↑ Spalding, Mark, Corinna Ravilious, and Edmund Green. 2001. World Atlas of Coral Reefs. Berkeley, CA: University of California Press and UNEP/WCMC.
- 1 2 3 4 Park, Chris C. (2001). The environment: principles and applications (2nd ed.). Routledge. p. 564. ISBN 978-0-415-21770-5.
Further reading
- Foley, JA; Monfreda, C; Ramankutty, N and Zaks, D (2007) Our share of the planetary pie Proceedings of the National Academy of Sciences of the USA, 104(31): 12585–12586. Download
- Haberl, H; Erb, KH; Krausmann, F; Gaube, V; Bondeau, A; Plutzar, C; Gingrich, S; Lucht, W and Fischer-Kowalski, M (2007) Quantifying and mapping the human appropriation of net primary production in earth's terrestrial ecosystems Proceedings of the National Academy of Sciences of the USA, 104(31):12942-12947. Download
- Purves, William K and Orians, Gordon H (2007) Life: The Science of Biology, 8th Ed. W. H. Freeman. ISBN 978-1-4292-0877-2
External links
| Look up biomass in Wiktionary, the free dictionary. |
- Counting bacteria
- Trophic levels
- Biomass distributions for high trophic-level fishes in the North Atlantic, 1900–2000

