Logarithmic scale
A logarithmic scale is a nonlinear scale used when there is a large range of quantities. Common uses include the earthquake strength, sound loudness, light intensity, and pH of solutions.
It is based on orders of magnitude, rather than a standard linear scale, so the value represented by each equidistant mark on the scale is the value at the previous mark multiplied by a constant.
Common usages
The following are examples of commonly used logarithmic scales, where a larger quantity results in a higher value:
- Richter magnitude scale and moment magnitude scale (MMS) for strength of earthquakes and movement in the earth
- bel and decibel for acoustic power (loudness)
- neper for amplitude, field and power quantities
- cent, minor second, major second, and octave for the relative pitch of notes in music
- logit for odds in statistics
- Palermo Technical Impact Hazard Scale
- logarithmic timeline
- counting f-stops for ratios of photographic exposure
- the rule of 'nines' used for rating low probabilities
- entropy in thermodynamics
- information in information theory
- particle-size-distribution curves of soil
- Energy Density of Uranium VS Fossil Fuels
The following are examples of commonly used logarithmic scales, where a larger quantity results in a lower (or negative) value:
- pH for acidity
- stellar magnitude scale for brightness of stars
- Krumbein scale for particle size in geology
- absorbance of light by transparent samples
Some of our senses operate in a logarithmic fashion (Weber–Fechner law), which makes logarithmic scales for these input quantities especially appropriate. In particular our sense of hearing perceives equal ratios of frequencies as equal differences in pitch. In addition, studies of young children in an isolated tribe have shown logarithmic scales to be the most natural display of numbers by humans.[1] It can also be used for geographical purposes like for measuring the speed of earthquakes.
Graphic representation
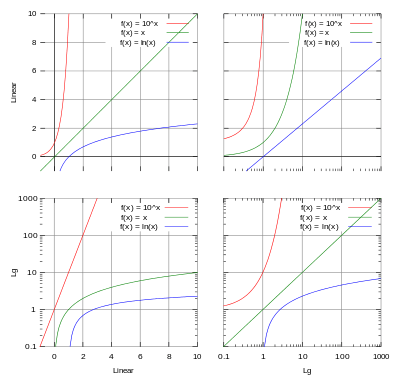
The top left graph is linear in the X and Y axis, and the Y-axis ranges from 0 to 10. A base-10 log scale is used for the Y axis of the bottom left graph, and the Y axis ranges from 0.1 to 1,000.
The top right graph uses a log-10 scale for just the X axis, and the bottom right graph uses a log-10 scale for both the X axis and the Y axis.
Presentation of data on a logarithmic scale can be helpful when the data:
- covers a large range of values, since the use of the logarithms of the values rather than the actual values reduces a wide range to a more manageable size;
- may contain exponential laws or power laws, since these will show up as straight lines.
A slide rule has logarithmic scales, and nomograms often employ logarithmic scales. The geometric mean of two numbers is midway between the numbers. Before the advent of computer graphics, logarithmic graph paper was a commonly used scientific tool.
Log–log plots
If both the vertical and horizontal axes of a plot are scaled logarithmically, the plot is referred to as a log–log plot.
Semi logarithmic plots
If only the ordinate or abscissa is scaled logarithmically, the plot is referred to as a semi-logarithmic plot.
See also
- Bit
- Byte
- Decade
- John Napier
- Level (logarithmic quantity)
- Logarithm
- Logarithmic mean
- Preferred number
References
- ↑ "Slide Rule Sense: Amazonian Indigenous Culture Demonstrates Universal Mapping Of Number Onto Space". ScienceDaily. 2008-05-30. Retrieved 2008-05-31.
Bibliography
- Dehaene, Stanislas; Izard, Véronique; Spelke, Elizabeth; Pica, Pierre (2008). "Log or linear? Distinct intuitions of the number scale in Western and Amazonian indigene cultures". Science. American Association for the Advancement of Science. 320 (5880): 1217–20. Bibcode:2008Sci...320.1217D. PMC 2610411
 . PMID 18511690. doi:10.1126/science.1156540.
External links
| Wikimedia Commons has media related to Logarithmic scale. |
