List of countries by traffic-related death rate
This list of countries by traffic-related death rate shows the annual number of road fatalities per capita per year, per amount of motor vehicles and per vehicle-km in some countries in the year the data was collected.
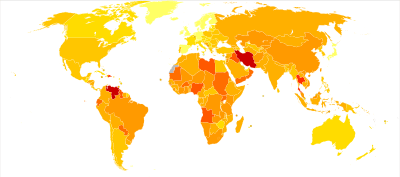
According to the World Health Organization, road traffic injuries caused an estimated 1.25 million deaths worldwide in the year 2010. That is, one person is killed every 25 seconds. Only 28 countries, representing 449 million people (7% of the world's population), have adequate laws that address all five risk factors (speed, drink–driving, helmets, seat-belts and child restraints). Over a third of road traffic deaths in low- and middle-income countries are among pedestrians and cyclists. However, less than 35% of low- and middle-income countries have policies in place to protect these road users.[2]
The average rate was 17.4 per 100,000 people. Low-income countries now have the highest annual road traffic fatality rates, at 24.1 per 100,000, while the rate in high-income countries is lowest, at 9.2 per 100,000.[2]
74% of road traffic deaths occur in middle-income countries, which account for only 53% of the world's registered vehicles. In low-income countries it is even worse. Only 1% of the world's registered cars produce 16% of world's road traffic deaths. This indicates that these countries bear a disproportionately high burden of road traffic deaths relative to their level of motorization.[2]
There are large disparities in road traffic death rates between regions. The risk of dying as a result of a road traffic injury is highest in the African Region (increasing 26.6 per 100 000 population), and lowest in the European Region (decreasing 9.3 per 100 000).[2]
Half of the world's road traffic deaths occur among motorcyclists (23%), pedestrians (22%) and cyclists (5%) – i.e. "vulnerable road users" – with 31% of deaths among car occupants and the remaining 19% among unspecified road users.[3]
Adults aged between 15 and 44 years account for 59% of global road traffic deaths. 77% road deaths are among men.[3]
The total fatalities figures comes from the WHO report (table A2, column point estimate, pp. 264–271) and are often an adjusted number of road traffic fatalities in order to reflect the different reporting and counting methods among the many countries (e.g. "a death after how many days since accident event is still counted as a road fatality?" (by standard adjusted to a 30 days period), or "to compensate for underreporting in some countries", see WHO report pp. 62–74).[2][4]
List
The table shows that the highest death tolls tend to be in African countries, and the lowest in European countries. The table first lists geographic regions before alphabetically sorted countries. A comparison between left-handed and right-handed traffic cannot be done without taking into account a variety of confounding factors such as the degree of compliance with traffic regulations, the level of policing, GDP per capita, the median/mode of the age of cars and many more.
| Country | Road fatalities per 100,000 inhabitants per year[4] |
Road fatalities per 100,000 motor vehicles[4] |
Road fatalities per 1 billion vehicle-km[5] |
Total fatalities latest year (adjusted/estimated figures by WHO report)[4] |
Year, data source (standard source: The WHO report 2015,[2] data from 2013) |
Left/Right traffic |
|---|---|---|---|---|---|---|
| World | 17.4 | 1,250,000 | ||||
| Africa | 26.6 | 574[6] | 246,719[6] | |||
| Eastern Mediterranean | 19.9 | 139[6] | 122,730[6] | |||
| Western Pacific | 17.3 | 69[6] | 328,591[6] | |||
| South-east Asia | 17.0 | 101[6] | 316,080[6] | |||
| Americas | 15.9 | 33[6] | 153,789[6] | |||
| Europe | 9.3 | 19[6] | 84,589[6] | |||
| | 15.5 | 722.4 | n/a | 4,734 | 2013 | Right |
| | 15.1 | 107.2 | n/a | 478 | 2013 | Right |
| | 23.8 | 127.8 | n/a | 9,337 | 2013 | Right |
| | 7.6 | 7.9 | n/a | 6 | 2013 | Right |
| | 26.9 | 992 | n/a | 5,769 | 2013 | Right |
| | 6.7 | 20 | n/a | 6 | 2013 | Left |
| | 13.6 | 24.3 | n/a | 5,619 | 2013 | Right |
| | 18.3 | 18.2 | n/a | 546 | 2013 | Right |
| | 5.4 | 7.3 | 5.2 | 1,252 | 2013 | Left |
| | 5.4 | 7.1 | 5.8 | 455 | 2013 | Right |
| | 10.0 | 83 | n/a | 943 | 2013 | Right |
| | 13.8 | 36 | n/a | 52 | 2013 | Left |
| | 8.0 | 19.6 | n/a | 107 | 2013 | Right |
| | 13.6 | 1020.6 | n/a | 21,316 | 2013 | Left |
| | 6.7 | 16.9 | n/a | 19 | 2013 | Left |
| | 13.7 | 32.9 | n/a | 1,282 | 2013 | Right |
| | 6.7 | 10.7 | 7.3 | 746 | 2013 | Right |
| | 24.4 | 26 | n/a | 81 | 2013 | Right |
| | 27.7 | 8177.2 | n/a | 2,855 | 2013 | Right |
| | 15.1 | 167.2 | n/a | 114 | 2013 | Left |
| | 23.2 | 205.2 | n/a | 3,476 | 2013 | Right |
| | 17.7 | 76.7 | n/a | 676 | 2013 | Right |
| | 23.6 | 91.6 | n/a | 477 | 2013 | Left |
| | 23.4 | 50.3 | 55.9[7] | 41,059 | 2013 | Right |
| | 8.3 | 17.2 | n/a | 601 | 2013 | Right |
| | 30.0 | 328.1 | n/a | 5,072 | 2013 | Right |
| | 26.1 | 229 | n/a | 130 | 2013 | Right |
| | 17.4 | 107.2 | n/a | 2,635 | 2013 | Right |
| | 27.6 | 1385.1 | n/a | 6,136 | 2013 | Right |
| | 6.0 | 9.5 | 6.2 | 2,114 | 2013 | Right |
| | 32.4 | 4336.5 | n/a | 1,495 | 2013 | Right |
| | 24.1 | 497 | n/a | 3,089 | 2013 | Right |
| | 12.4 | 51.1 | n/a | 2,179 | 2013 | Right |
| | 18.8 | 104.5 | n/a | 261,367 | 2013 | Right |
| | 16.8 | 83.3 | n/a | 8,107 | 2013 | Right |
| | 26.4 | 1063 | n/a | 1,174 | 2013 | Right |
| | 24.2 | 40.2 | n/a | 5 | 2013 | Left |
| | 13.9 | 38.4 | n/a | 676 | 2013 | Right |
| | 24.2 | 828.9 | n/a | 4,924 | 2013 | Right |
| | 9.2 | 21.1 | n/a | 395 | 2013 | Right |
| | 7.5 | 133.7 | n/a | 840 | 2013 | Right |
| | 5.2 | 9.2 | n/a | 59 | 2013 | Left |
| | 6.1 | 8.5 | 13.9 | 654 | 2013 | Right |
| | 33.2 | 6405.4 | n/a | 22,419 | 2013 | Right |
| | 3.5 | 6.7 | 4 | 196 | 2013 | Right |
| | 15.3 | 44.7 | n/a | 11 | 2013 | Left |
| | 29.3 | 94.9 | n/a | 3,052 | 2013 | Right |
| | 20.1 | 183.8 | n/a | 3,164 | 2013 | Right |
| | 12.8 | 148.7 | n/a | 10,466 | 2013 | Right |
| | 21.1 | 163.7 | n/a | 1,339 | 2013 | Right |
| | 24.1 | 2171.5 | n/a | 1,527 | 2013 | Right |
| | 7.0 | 11.8 | n/a | 90 | 2013 | Right |
| | 25.3 | 4984.3 | n/a | 23,837 | 2013 | Right |
| | 5.8 | 58.9 | n/a | 51 | 2013 | Left |
| | 4.8 | 4.4 | 4.8 | 258 | 2013 | Right |
| | 5.1 | 7.6 | 5.8 | 3,268 | 2013 | Right |
| | 22.9 | 196.4 | n/a | 383 | 2013 | Right |
| | 29.4 | 998.7 | n/a | 544 | 2013 | Right |
| | 11.8 | 54 | n/a | 514 | 2013 | Right |
| | 4.3 | 6.8 | 4.9 | 3,540 | 2013 | Right |
| | 26.2 | 443.1 | n/a | 6,789 | 2013 | Right |
| | 9.1 | 12.6 | n/a | 1,013 | 2013 | Right |
| | 19.0 | 114.7 | n/a | 2,939 | 2013 | Right |
| | 27.3 | 9462.5 | n/a | 3,211 | 2013 | Right |
| | 27.5 | 751.9 | n/a | 468 | 2013 | Right |
| | 17.3 | 864.4 | n/a | 138 | 2013 | Left |
| | 17.4 | 1021.7 | n/a | 1,408 | 2013 | Right |
| | 7.7 | 20.7 | n/a | 765 | 2013 | Right |
| | 4.6 | 6.1 | 4.7 | 15 | 2013 | Right |
| | 16.6 | 130.1 | n/a | 238,562 | 2013 | Left |
| | 15.3 | 36.7 | n/a | 38,279 | 2013 | Left |
| | 32.1 | 92.7 | n/a | 24,896 | 2013 | Right |
| | 20.2 | 151.2 | n/a | 6,826 | 2013 | Right |
| | 4.1 | 7.6 | 3.9 | 188 | 2013 | Left |
| | 3.6 | 9.7 | 5.3 | 277 | 2013 | Right |
| | 6.1 | 7.3 | n/a | 3,753 | 2013 | Right |
| | 11.5 | 61.7 | n/a | 320 | 2013 | Left |
| | 4.7 | 6.5 | 8 | 5,971 | 2013 | Left |
| | 26.3 | 151.4 | n/a | 1,913 | 2013 | Right |
| | 24.2 | 101.4 | n/a | 3,983 | 2013 | Right |
| | 29.1 | 640.7 | n/a | 12,891 | 2013 | Left |
| | 2.9 | 86.9 | n/a | 3 | 2013 | Left |
| | 18.7 | 34.2 | n/a | 629 | 2013 | Right |
| | 22.0 | 127.3 | n/a | 1,220 | 2013 | Right |
| | 14.3 | 67.5 | n/a | 971 | 2013 | Right |
| | 10.0 | 24.8 | n/a | 205 | 2013 | Right |
| | 22.6 | 64.8 | n/a | 1,088 | 2013 | Right |
| | 28.2 | 474.8 | n/a | 584 | 2013 | Left |
| | 33.7 | 133.4 | n/a | 1,448 | 2013 | Right |
| | 73.4 | 128.2 | n/a | 4,554 | 2013 | Right |
| | 10.6 | 16.1 | n/a | 320 | 2013 | Right |
| | 8.7 | 10.7 | n/a | 46 | 2013 | Right |
| | 9.4 | 49.1 | n/a | 198 | 2013 | Right |
| | 28.4 | 2963 | n/a | 6,506 | 2013 | Right |
| | 35.0 | 1310.4 | n/a | 5,732 | 2013 | Left |
| | 24.0 | 29.9 | 12.6 | 7,129 | 2013 | Left |
| | 3.5 | 19.5 | n/a | 12 | 2013 | Left |
| | 25.6 | 1352.5 | n/a | 3,920 | 2013 | Right |
| | 5.1 | 6.8 | n/a | 22 | 2013 | Left |
| | 5.7 | 141.8 | n/a | 3 | 2013 | Right |
| | 24.5 | 228.7 | n/a | 952 | 2013 | Right |
| | 12.2 | 35.6 | n/a | 158 | 2013 | Left |
| | 12.3 | 43 | n/a | 15,062 | 2013 | Right |
| | 1.9 | 24 | n/a | 2 | 2013 | Right |
| | - | - | n/a | 0 | 2013 | Right |
| | 21.0 | 88.4 | n/a | 597 | 2013 | Right |
| | 11.9 | 36.8 | n/a | 74 | 2013 | Right |
| | 18.0 | 209 | n/a | 6,870 | 2013 | Right |
| | 31.6 | 1507 | n/a | 8,173 | 2013 | Left |
| | 20.3 | 250.8 | n/a | 10,809 | 2013 | Right |
| | 23.9 | 196.4 | n/a | 551 | 2013 | Left |
| | 17.0 | 399.8 | n/a | 4,713 | 2013 | Left |
| | 3.4 | 6 | 4.5 | 574 | 2013 | Right |
| | 6.0 | 8.4 | 6.7 | 272 | 2013 | Left |
| | 15.3 | 164.3 | n/a | 931 | 2013 | Right |
| | 26.4 | 1491.1 | n/a | 4,706 | 2013 | Right |
| | 20.5 | 615.4 | n/a | 35,621 | 2013 | Right |
| | 3.8 | 5.2 | 4.4 | 192 | 2013 | Right |
| | 25.4 | 85.3 | n/a | 924 | 2013 | Right |
| | 14.2 | 283.9 | n/a | 25,781 | 2013 | Left |
| | 4.8 | 14.1 | n/a | 1 | 2013 | Right |
| | 10.0 | 38.4 | n/a | 386 | 2013 | Right |
| | 16.8 | 1306.5 | n/a | 1,232 | 2013 | Left |
| | 20.7 | 114.7 | n/a | 1,408 | 2013 | Right |
| | 13.9 | 99.3 | n/a | 4,234 | 2013 | Right |
| | 10.5 | 135 | n/a | 10,379 | 2013 | Right |
| | 10.3 | 15.8 | n/a | 3,931 | 2013 | Right |
| | 7.8 | 13.7 | n/a | 828 | 2013 | Right |
| | 15.2 | 50.9 | n/a | 330 | 2013 | Right |
| | 9.5[8] | 21.2 | 16 | 4,899 | 2016[9] | Right |
| | 12.5 | 61.8 | n/a | 437 | 2013 | Right |
| | 8.7 | 31.4 | n/a | 1,881 | 2013 | Right |
| | 18.9 | 53.4 | n/a | 27,025 | 2013 | Right |
| | 32.1 | 3521.1 | n/a | 3,782 | 2013 | Right |
| | 18.1 | 2103.3 | n/a | 33 | 2013 | Left |
| | 8.2 | 31.7 | n/a | 9 | 2013 | Left |
| | 15.8 | 171.9 | n/a | 30 | 2013 | Left |
| | 3.2 | 1.8 | n/a | 1 | 2013 | Right |
| | 31.1 | 5454.5 | n/a | 60 | 2013 | Right |
| | 27.4 | 119.7 | n/a | 7,898 | 2013 | Right |
| | 27.2 | 956.4 | n/a | 3,844 | 2013 | Right |
| | 10.4 | 34.5 | n/a | 735 | 2013 | Right |
| | 8.6 | 43 | n/a | 8 | 2013 | Left |
| | 27.3 | 2414.2 | n/a | 1,661 | 2013 | Right |
| | 3.6 | 20.2 | n/a | 197 | 2013 | Left |
| | 6.6 | 13.7 | n/a | 360 | 2013 | Right |
| | 6.4 | 9.5 | 7.6 | 132 | 2013 | Right |
| | 19.2 | 240 | n/a | 108 | 2013 | Left |
| | 25.4 | 4480.5 | n/a | 2,664 | 2013 | Right |
| | 25.1 | 133.9 | n/a | 13,273 | 2013 | Left |
| | 3.7 | 5.3 | 7.8 | 1,730 | 2013 | Right |
| | 17.4 | 70.9 | n/a | 3,691 | 2013 | Left |
| | 24.3 | 2872.8 | n/a | 9,221 | 2013 | Right |
| | 19.1 | 49.7 | n/a | 103 | 2013 | Left |
| | 24.2 | 1667.4 | n/a | 303 | 2013 | Left |
| | 2.8 | 4.7 | 3.5 | 272 | 2013 | Right |
| | 3.3 | 4.7 | 4.3 | 269 | 2013[10][11][12][13] | Right |
| | 18.8 | 374.9 | n/a | 1,543 | 2013 | Right |
| | 36.2 | 74.6 | n/a | 24,237 | 2013 | Left |
| | 16.6 | 295.8 | n/a | 188 | 2013 | Left |
| | 31.1 | 3653.4 | n/a | 2,123 | 2013 | Right |
| | 7.6 | 98.1 | n/a | 8 | 2013 | Left |
| | 14.1 | 58.9 | n/a | 189 | 2013 | Left |
| | 24.4 | 154.4 | n/a | 2,679 | 2013 | Right |
| | 8.9 | 37.3 | n/a | 6,687 | 2013 | Right |
| | 17.4 | 107.8 | n/a | 914 | 2009 | Right |
| | 27.4 | 836.8 | n/a | 10,280 | 2013 | Left |
| | 10.9 | 38.2 | n/a | 1,021 | 2013 | Right |
| | 2.9 | 5.1 | 3.6 | 1,827 | 2013 | Left |
| | 32.9 | 1073.7 | n/a | 16,211 | 2013 | Left |
| | 13.5[3] | 35.3 | n/a | 5,099 | 2012[14] | Right |
| | 10.6 | 12.9 | 7.1 | 34,064 | 2013 | Right |
| | 16.6 | 28.5 | n/a | 567 | 2013 | Right |
| | 11.2 | n/a | 3,240 | 2013 | Right | |
| | 16.6 | 300 | n/a | 42 | 2013 | Right |
| | 24.5 | 55 | n/a | 22,419 | 2013 | Right |
| | 21.5 | 436.6 | n/a | 5,248 | 2013 | Right |
| | 24.7 | 670.9 | n/a | 3,586 | 2013 | Left |
| | 28.2 | 429.8 | n/a | 3,985 | 2013 | Left |
See also
- Epidemiology of motor vehicle collisions
- Traffic collision
- Road-traffic safety
- Smeed's law
- List of countries by vehicles per capita
Nations:
- List of motor vehicle deaths in Australia by year
- List of motor vehicle deaths in Japan by year
- List of motor vehicle deaths in U.S. by year
- List of road traffic accidents deaths in Republic of Ireland by year
General:
Notes
- ↑ The following groupings/assumptions were made:
- France includes the overseas departments as well as overseas collectivities.
- The United Kingdom includes the Crown dependencies as well as the overseas territories.
- The United States of America includes the insular areas.
- The Netherlands includes Aruba and the Netherlands Antilles.
- Denmark includes Greenland and the Faroe islands.
- China includes the province and SARs of Hong Kong and Macao.
References
- ↑ Data from World Health Organization Estimated Deaths 2012
- 1 2 3 4 5 6 WHO, ed. (2015). "Global Status Report on Road Safety 2015" (PDF) (official report). Geneva, Switzerland: World Health Organisation (WHO). pp. vii, 1–14, 75ff (countries), 264–271 (table A2), 316–332 (table A10). ISBN 978 92 4 156506 6. Retrieved 2016-01-27.
Tables A2 & A10, data from 2013
- 1 2 3 WHO, ed. (2013). "Global Status Report on Road Safety 2013: supporting a decade of action" (PDF) (official report). Geneva, Switzerland: World Health Organisation (WHO). pp. vii, 1–8, 53ff (countries), 244–251 (table A2), 296–303 (table A10). ISBN 978 92 4 156456 4. Retrieved 2014-05-30.
Tables A2 & A10, data from 2010
- 1 2 3 4 WHO, ed. (2015). "WHO Report 2015: Data tables" (PDF) (official report). Geneva, Switzerland: World Health Organisation (WHO). Retrieved 2016-01-26.
- ↑ OECD/ITF, ed. (12 October 2015). "Road Safety Annual Report 2015" (PDF) (official report). Paris: International Traffic Safety Data and Analysis Group, International Transport Forum (irtad). pp. 47ff. ISBN 9789282107867. Retrieved 2016-01-29.
data from 2013
- 1 2 3 4 5 6 7 8 9 10 11 12 WHO, ed. (2015). "Deaths on the roads: Based on the WHO Global Status Report on Road Safety 2015" (PDF) (official report). Geneva, Switzerland: World Health Organisation (WHO). Retrieved 2016-01-26.
- ↑ Center for Traffic Safety Research - University of São Paulo(in Portuguese: Núcleo de Estudos em Segurança no Trânsito - NEST-USP)Master degree dissertation of Jorge Tiago Bastos published in 2011. Title: Geography of Traffic Fatalities in Brazil (in Portuguese: Geografia da mortalidade no trânsito no Brasil. School of Engineering of São Carlos - University of São Paulo, Department of Transportation, São Carlos - Brazil (data for 2008))
- ↑ Official population estimate
- ↑ ? (26 February 2017). "음주운전 사망 큰폭 감소…지난해 교통사고 사망자 7.1% 줄어". Yonhap News (in Korean). Retrieved 2017-02-26.
- ↑ "Mobility and Transport: Pocket Statistics 2014" (PDF) (Official publication) (in English, German, French, and Italian). Switzerland: Federal Office for Statistics. 30 July 2013. Retrieved 2014-10-14.
- ↑ "Mobility and Transport: Key figures" (web page) (in English, German, French, and Italian). Switzerland: Federal Office for Statistics. October 2014. Retrieved 2014-10-14.
- ↑ "Passenger transport performance" (web page) (in English, German, French, and Italian). Switzerland: Federal Office for Statistics. October 2014. Retrieved 2014-10-14.
- ↑ "Verkehrsunfälle in der Schweiz 2012, Korrigierte Version, 30.8.2013" (PDF) (Official publication) (in German, French, and Italian). Switzerland: Federal Office for Statistics. 30 August 2013. Retrieved 2014-10-14.
- ↑ Число аварий по сравнению с 2011 годом возросло. Погибших оказалось тоже больше. www.liga.net (in Russian). ЛIГАБiзнесIнформ Информационное агентство. 27 February 2013. Retrieved 2016-04-14.