List of sovereign states in Europe by GNI (nominal) per capita
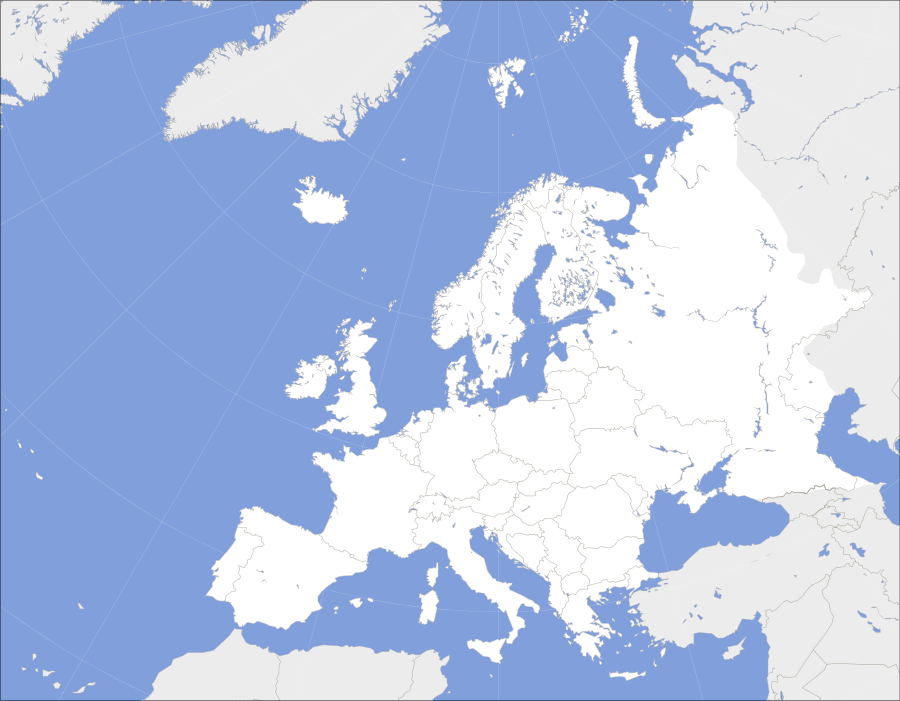
This is a map of European countries by GNI (Gross national income nominal) per capita for year 2016[1]. High income[2] in purple ($12,236 or more, as defined by the World Bank), upper middle income in orange ($3,956 and $12,235) and lower middle income ($1,006 and $3,955) in red.

World Bank high-income economies in Europe in 2016
| State (51) [3] | GNI (nominal) per capita [4] | GDP (nominal) per capita[5] | GDP PPP per capita[6] | GNI PPP per capita[7] |
|---|---|---|---|---|
| |
4,250 | 4,147 | 11,929 | 11,880 |
| |
n/d | n/d | n/d | n/d |
| |
3,760 | 3,606 | 8,818 | 9,000 |
| |
45,230 | 44,177 | 50,078 | 49,990 |
| |
4,760 | 3,877 | 17,253 | 16,130 |
| |
5,600 | 4,989 | 18,060 | 17,210 |
| |
41,860 | 40,231 | 41,096 | 46,010 |
| |
4,880 | 4,709 | 12,075 | 12,140 |
| |
7,470 | 7,351 | 19,199 | 19,020 |
| |
12,110 | 12,091 | 23,596 | 22,880 |
| |
23,680[8] | 23,324 | 32,580 | 31,420 |
| |
17,570 | 18,267 | 34,711 | 32,710 |
| |
56,730 | 53,418 | 49,696 | 51,040 |
| |
17,750 | 17,575 | 29,365 | 28,920 |
| |
44,730 | 43,090 | 43,053 | 43,400 |
| |
38,950[9] | 36,855 | 41,466 | 42,380 |
| |
3,810 | 3,854 | 9,997 | 9,450 |
| |
43,660 | 41,936 | 48,730 | 49,530 |
| |
18,960 | 18,104 | 26,783 | 26,900 |
| |
12,570 | 12,665 | 26,681 | 25,640 |
| |
56,990 | 59,977 | 51,399 | 52,490 |
| |
52,560 | 61,607 | 68,883 | 56,870 |
| |
31,590 | 30,527 | 38,161 | 38,230 |
| |
8,710 | 7,510 | 25,264 | 22,910 |
| |
3,850 | 3,661 | 10,066 | 10,200 |
| |
14,630 | 14,118 | 26,031 | 26,090 |
| |
n/d | n/d | n/d | n/d |
| |
14,770 | 14,880 | 29,966 | 28,840 |
| |
76,660 | 102,831 | 105,882 | 75,750 |
| |
4,980 | 5,237 | 15,121 | 14,480 |
| |
24,140 | 25,058 | 37,899 | 35,720 |
| |
2,120[10] | 1,900 | 5,334 | 5,670 |
| |
n/d | n/d | n/d | n/d |
| |
6,970 | 6,701 | 16,854 | 17,090 |
| |
46,310 | 45,295 | 50,898 | 50,320 |
| |
82,330 | 70,813 | 59,302 | 62,510 |
| |
12,680 | 12,372 | 27,811 | 26,770 |
| |
19,850 | 19,813 | 30,624 | 29,990 |
| |
9,470 | 9,474 | 23,626 | 22,950 |
| |
9,720 | 8,748 | 23,163 | 22,540 |
| |
n/d | n/d | n/d | n/d |
| |
5,280 | 5,348 | 14,512 | 13,680 |
| |
16,810 | 16,496 | 30,632 | 29,910 |
| |
21,660 | 21,305 | 32,885 | 32,360 |
| |
27,520 | 26,529 | 36,310 | 36,340 |
| |
54,630 | 51,600 | 49,175 | 50,000 |
| |
81,240 | 78,813 | 62,882 | 63,660 |
| |
11,180 | 10,788 | 24,244 | 23,990 |
| |
2,310 | 2,186 | 8,272 | 8,190 |
| |
42,390 | 39,900 | 42,609 | 42,100 |
| |
n/d | n/d | n/d | n/d |
upper middle income ($3,956 and $12,235)
lower middle income ($1,006 and $3,955)
See also
- International organisations in Europe
- List of European countries by budget revenues
- List of European countries by budget revenues per capita
- List of European countries by GDP (nominal) per capita
- List of European countries by GDP (PPP) per capita
- List of European countries by GNI (PPP) per capita
- List of sovereign states in Europe by net average wage
- List of countries by GDP (nominal) per capita
- List of countries by GDP (PPP) per capita
- List of countries by GDP (nominal)
- List of countries by GDP (PPP)
- List of countries by GNI (nominal) per capita
References
- ↑ GNI (nominal) per capita for year 2016, World Development Indicators database, Atlas method, World Bank, revised 01 July 2017
- ↑ World Bank Country Classification for 2016
- ↑ Only 51 sovereign states are listed, including Kosovo and Vatican which are not UN members
- ↑ GNI (nominal) per capita for year 2016, World Development Indicators database, Atlas method, World Bank, revised 01 July 2017
- ↑ GDP (nominal) per capita (World Bank Database), revised 01 July 2017
- ↑ GDP (PPP) per capita (World Bank Database), revised 01 July 2017
- ↑ GNI (PPP) per capita (World Bank Database), revised 01 July 2017
- ↑ Excludes Turkish Cypriot side(Northern Cyprus).
- ↑ Data include the French overseas departments of French Guiana, Guadeloupe, Martinique and Réunion.
- ↑ Data exclude Transnistria.
- ↑ World Bank Country Classification for 2016
This article is issued from
Wikipedia.
The text is licensed under Creative Commons - Attribution - Sharealike.
Additional terms may apply for the media files.