List of largest cities
| Population tables of world cities |
|---|
.jpg) |
Determining the world's largest cities depends on which definitions of city are used. The United Nations uses three definitions for what constitutes a city, as not all cities may be classified using the same criteria.[1] Cities may be defined as the cities proper, the extent of their urban area, or their metropolitan regions.[1]
Common methods for defining the boundaries of a city
City proper (administrative)
A city can be defined by its administrative boundaries (city proper). World Urbanization Prospects, a UN publication, defines population of a city proper as "the population living within the administrative boundaries of a city or controlled directly from the city by a single authority." UNICEF[1] defines city proper as "the population living within the administrative boundaries of a city, e.g., Washington, D.C.". A city proper is a locality defined according to legal or political boundaries and an administratively recognised urban status that is usually characterised by some form of local government.[2][3][4] Cities proper and their boundaries and population data may not include suburbs.[5]
The use of city proper as defined by administrative boundaries may not include suburban areas where an important proportion of the population working or studying in the city lives.[5] Because of this definition, the city proper population figure may differ greatly with the urban area population figure, as many cities are amalgamations of smaller cities (Australia), and conversely, many Chinese cities govern territories that extend well beyond the traditional "city proper" into suburban and rural areas.[6]
Urban area
See also: Number of urban areas by country
A city can be defined as a conditionally contiguous urban area, without regard to territorial or other boundaries inside an urban area. UNICEF[1] defines urban area as follows:
The definition of "urban" varies from country to country, and, with periodic reclassification, can also vary within one country over time, making direct comparisons difficult. An urban area can be defined by one or more of the following: administrative criteria or political boundaries (e.g., area within the jurisdiction of a municipality or town committee), a threshold population size (where the minimum for an urban settlement is typically in the region of 2,000 people, although this varies globally between 200 and 50,000), population density, economic function (e.g., where a significant majority of the population is not primarily engaged in agriculture, or where there is surplus employment) or the presence of urban characteristics (e.g., paved streets, electric lighting, sewerage).
Metropolitan area
A city can be defined by the habits of its demographic population, as by metropolitan area, labour market area, or similar in a metropolitan area. UNICEF[1] defines metropolitan area as follows:
A formal local government area comprising the urban area as a whole and its primary commuter areas, typically formed around a city with a large concentration of people (i.e., a population of at least 100,000). In addition to the city proper, a metropolitan area includes both the surrounding territory with urban levels of residential density and some additional lower-density areas that are adjacent to and linked to the city (e.g., through frequent transport, road linkages or commuting facilities).
Largest cities
| City | Country | Image | Population | |||
|---|---|---|---|---|---|---|
| City proper | Metropolitan area | Urban area[7] | ||||
| Shanghai | |
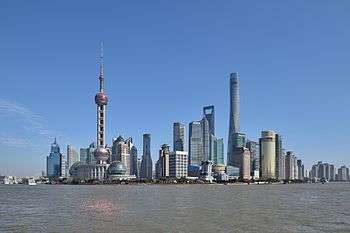 |
24,256,800[8] | 34,750,000[9] | 23,416,000[lower-alpha 1] | |
| Karachi | |
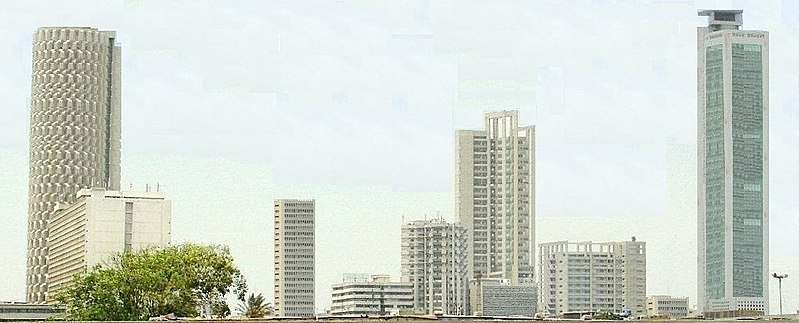 |
23,500,000[10] | 25,100,000[11] | 25,400,000 | |
| Beijing | |
_-_panoramio.jpg) |
21,516,000[12] | 24,900,000[13] | 21,009,000 | |
| Delhi | |
 |
11,034,555[14] | 24,998,000 | 21,753,486[15] | |
| Lagos | |
 |
16,060,303[lower-alpha 2] | 21,000,000[18] | 13,123,000 | |
| Dhaka | |
 |
14,543,124[19][20] | 18,898,000[21][22] | ||
| Guangzhou | |
 |
14,043,500[23] | 44,259,000[24] | 20,800,654[25] | |
| Istanbul | |
 |
14,025,000[26] | 13,520,000 | 14,657,000[26] | |
| Tokyo | |
.jpg) |
13,513,734[27] | 37,843,000 | 36,923,000[28] | |
| Mumbai | |
 |
12,478,447[15] | 17,712,000 | 20,748,395[15] | |
| Moscow | |
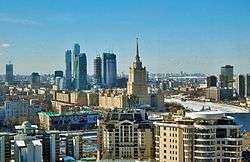 |
12,197,596[29] | 16,170,000 | 16,800,000 | |
| São Paulo | |
 |
12,038,175[30] | 21,090,791 | 36,842,102[31] | |
| Shenzhen | |
 |
10,778,900[32][lower-alpha 3] | 12,084,000 | ||
| Suzhou | |
 |
10,650,501[33] | |||
| Lahore | |
 |
10,355,000 | 13,569,000 | 10,665,000[34] | |
| Cairo | |
 |
10,230,350[35] | 18,290,000 | 22,439,541 | |
| Kinshasa | |
|
10,130,000[36] | 13,265,000 | ||
| Jakarta | |
 |
10,075,310[37] | 30,539,000 | 30,075,310[38] | |
| Seoul | |
 |
9,995,784[39] | 12,700,000 | 25,520,000[40] | |
| Mexico City | |
 |
8,974,724[41] | 20,063,000 | 21,178,959[42] | |
| Lima | |
 |
8,852,000[43] | 10,750,000 | 9,886,647[44] | |
| London | |
|
8,787,892[45] | 13,879,757 | 9,787,426[46] | |
| Xi'an | |
 |
8,705,600[47] | 13,569,700[48] | ||
| New York City | |
 |
8,550,405[49] | 20,182,305 | 23,723,696[50] | |
| Bengaluru | |
 |
8,425,970[15] | 9,807,000 | 8,728,906[15] | |
| Bangkok | |
.jpg) |
8,280,925[51] | 14,998,000 | 8,305,218[51] | |
| Nanjing | |
 |
8,230,000[52] | 34,360,000[53] | ||
| Dongguan | |
 |
8,220,207[54][32][lower-alpha 4] | |||
| Chongqing | |
 |
8,189,800[lower-alpha 5] | 52,100,100 | 36,700,000[56] | |
| Tehran | |
 |
8,154,051[57] | 13,532,000 | 14,595,904[58] | |
| Quanzhou | |
|
8,128,533 | 6,107,475 | 1,435,185 | |
| Shenyang | |
|
8,106,171[59] | |||
| Bogotá | |
 |
7,878,783 [60] | 9,800,000[61][62] | 9,520,000[7] | |
| Hyderabad | |
 |
7,859,250[15] | 8,955,450[15] | ||
| Ho Chi Minh City | |
 |
7,681,700[63] | |||
| Hong Kong | |
.jpg) |
7,374,900[64] | |||
| Baghdad | |
 |
7,180,889[65] | |||
| Fuzhou | |
 |
7,115,369 | 4,468,076 | ||
| Chennai | |
 |
7,088,000[66] | 9,373,521[15] | ||
| Changsha | |
 |
7,044,118[67] | |||
| Wuhan | |
 |
6,886,253[68] | |||
| Tianjin | |
 |
6,859,779[69] | 15,469,500 | 12,784,000 | |
| Hanoi | |
 |
6,844,100[63] | |||
| Faisalabad | |
 |
6,480,765[70] | 3,675,000 | ||
| Rio de Janeiro | |
 |
6,429,923[71] | 12,727,000 | 13,973,505[30] | |
| Qingdao | |
 |
6,188,100 | 9,046,200 | 6,188,100 | |
| Foshan | |
 |
6,151,622[72][73][32][lower-alpha 6] | |||
| Zunyi | |
 |
6,127,009 | |||
| Santiago | |
 |
5,743,719[74] | 6,683,852[75] | ||
| Riyadh | |
 |
5,676,621[76] | |||
| Ahmedabad | |
 |
5,570,585[15] | 6,352,254[15] | ||
| Singapore | |
 |
5,535,000[77] | |||
| Shantou | |
 |
5,391,028[78] | 11,535,677 | ||
| Ankara | |
 |
5,271,000[26] | 4,585,000[26] | 4,919,000[26] | |
| Yangon | |
.jpg) |
5,214,000[79] | |||
| Saint Petersburg | |
 |
5,191,690[80] | 5,900,000 | 6,200,000 | |
| Casablanca | |
 |
5,117,832[81] | 6,861,739 | 6,861,739 | |
| Abidjan | |
 |
4,765,000[82] | |||
| Chengdu | |
 |
4,741,929[83] | 10,376,000 | ||
| Alexandria | |
 |
4,616,625[84] | |||
| Kolkata | |
 |
4,486,679[15] | 14,667,000 | 14,617,882[15] | |
| Surat | |
 |
4,462,002[15] | |||
| Johannesburg | |
 |
4,434,827[85] | |||
| Dar es Salaam | |
 |
4,364,541[86] | |||
| Shijiazhuang | |
 |
4,303,700 | 10,701,600 | 4,303,700 | |
| Harbin | |
 |
4,280,701[87][88] | 10,635,971 | 6,704,573 | |
| Giza | |
 |
4,239,988[89] | |||
| İzmir | |
 |
4,168,000[26] | 3,019,000[26] | 3,575,000[26] | |
| Zhengzhou | |
 |
4,122,087[90] | |||
| New Taipei City | |
 |
3,954,929[91] | |||
| Los Angeles | |
 |
3,884,307[92] | 15,058,000 | 13,262,220[50] | |
| Changchun | |
.jpg) |
3,815,270 | 7,674,439[93] | 4,193,073 | |
| Cape Town | |
 |
3,740,026[85] | |||
| Yokohama | |
 |
3,726,167[27][lower-alpha 7] | |||
| Khartoum | |
 |
3,639,598 | 5,274,321 | 5,345,000[94] | |
| Guayaquil | |
|
3,600,000[95] | 5,000,000 | ||
| Hangzhou | |
 |
3,560,391[96] | |||
| Xiamen | |
 |
3,531,347[97] | 5,114,758 | 1,861,289 | |
| Berlin | |
 |
3,517,424[98] | 5,871,022 | ||
| Busan | |
 |
3,510,833[40] | 8,202,239[99] | ||
| Ningbo | |
|
3,491,597[100] | 7,639,000 | 3,491,597 | |
| Jeddah | |
 |
3,456,259[101] | |||
| Durban | |
 |
3,442,361[85] | |||
| Hyderabad | |
|
3,429,471[102] | |||
| Algiers | |
|
3,415,811 | 5,000,000 | ||
| Kabul | |
 |
3,414,100[103] | |||
| Hefei | |
 |
3,352,076[104] | |||
| Mashhad | |
 |
3,312,090 | 3,372,660 | ||
| Pyongyang | |
 |
3,255,388[105] | |||
| Madrid | |
_1.jpg) |
3,207,247[106] | 6,378,297[46] | ||
| Baku | |
|
3,202,300 | 4,308,740 | 3,525,000[107] | |
| Peshawar | |
|
3,201,000 | |||
| Rawalpindi | |
 |
3,198,911[108] | |||
| Tangshan | |
 |
3,187,171 | 7,536,521 | 3,187,171 | |
| Ekurhuleni | |
 |
3,178,470[85] | |||
| Nairobi | |
.jpg) |
3,138,369[109] | |||
| Zhongshan | |
 |
3,121,275[110] | |||
| Multan | |
 |
3,117,000[111] | |||
| Pune | |
 |
3,115,431[15] | |||
| Addis Ababa | |
|
3,103,673[112] | 4,567,857 | 3,384,569 | |
| Jaipur | |
 |
3,073,350[15] | |||
| Buenos Aires | |
 |
3,054,300[113] | 14,122,000 | 13,074,000[114] | |
| Wenzhou | |
|
9,122,102[115] | 3,039,439[115] | 6,642,592[115] | |
| Incheon | |
 |
2,978,367[116] | |||
| Quezon City | |
|
2,936,116[117][lower-alpha 8] | |||
| Kiev | |
 |
2,908,703 [118] | 3,375,000[119] | ||
| Salvador | |
|
2,902,927[120] | 3,919,864[121] | ||
| Rome | |
.jpg) |
2,877,215[122] | 4,353,775[123][lower-alpha 9] | ||
| Luanda | |
|
2,825,311 | 6,542,944[124] | ||
| Lucknow | |
 |
2,815,601[15] | |||
| Kaohsiung | |
 |
2,778,918[125] | 2,540,000 | ||
| Kanpur | |
 |
2,768,057[126] | 3,152,317 | 2,920,496[127] | |
| Surabaya | |
 |
2,765,487[128] | 7,302,283 | 9,115,485[129][130] | |
| Taichung | |
|
2,752,413[131] | 2,520,000[132] | ||
| Basra | |
 |
2,750,000[133] | |||
| Toronto | |
 |
2,731,571 | 6,417,516 | 6,129,900 | |
| Taipei | |
 |
2,704,974 | 7,045,488[134] | ||
| Gujranwala | |
 |
2,700,003[135] | |||
| Chicago | |
 |
2,695,598[136] | 9,156,000 | 9,554,598[50] | |
| Osaka | |
 |
2,691,742[27] | 19,341,976[28] | 17,444,000 | |
| Quito | |
 |
2,671,191 | 4,700,000 | ||
| Chaozhou | |
 |
2,669,844 | |||
| Dubai | |
 |
2,643,410 | |||
| Fortaleza | |
.jpg) |
2,609,716 | 4,019,213 | ||
| Chittagong | |
.jpg) |
2,581,643[137] | 4,009,423 | ||
| Bandung | |
 |
2,575,478 | 6,965,655 | 8,495,928[129] | |
| Managua | |
 |
2,560,789 | 2,205,676 | ||
| Brasília | |
 |
2,556,149[138] | 3,919,864[121] | ||
| Belo Horizonte | |
 |
2,502,557[139] | 5,156,217 | ||
| Daegu | |
 |
2,492,994[140] | |||
| Houston | |
 |
2,489,558[141] | 6,490,180 | 4,944,332 | |
| Douala | |
 |
2,446,945[142] | |||
| Medellin | |
 |
2,441,123[143] | 3,731,447 | 2,497,870 | |
| Yaoundé | |
 |
2,440,462[142] | |||
| Nagpur | |
 |
2,405,665[144] | 2,497,870 | ||
| Cali | |
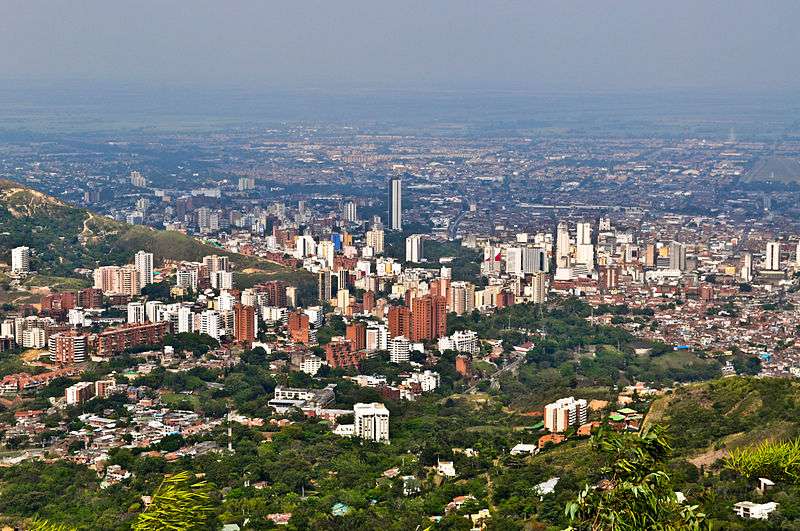 |
2,400,653[145] | 3,400,000 | ||
| Tashkent | |
 |
2,309,600 | |||
| Nagoya | |
 |
2,296,014[27] | 9,107,414[28] | 10,177,000 | |
| Isfahan | |
 |
2,243,249 | |||
| Phnom Penh | |
 |
2,234,566 | |||
| Kochi | |
 |
2,232,456 | 4,221,140 | ||
| Paris | |
 |
2,229,621 | 10,601,122 | ||
| Ouagadougou | |
 |
2,200,000 | 2,500,000 | ||
| Lanzhou | |
.jpg) |
2,177,130 | 3,616,163 | 2,177,130 | |
| Kano | |
 |
2,153,225 | 3,395,000 | 9,383,682 | |
| Dalian | |
 |
2,146,099 | 5,935,638 | 3,964,593 | |
| Guatemala City | |
 |
2,110,100[146] | 4,500,000[146] | ||
| Havana | |
 |
2,106,146[147] | |||
| Medan | |
 |
2,097,610 | 4,103,696 | ||
| Accra | |
|
2,070,463[148] | 4,010,054[148] | ||
| Visakhapatnam | |
 |
2,035,922 | 5,340,000[149] | ||
| Jinan | |
 |
2,009,273 | 5,853,196 | ||
| Karaj | |
|
1,973,470 | |||
| Minsk | |
 |
1,959,781[150] | |||
| Caracas | |
 |
1,943,901 | 2,923,959 | ||
| Sana'a | |
.jpg) |
1,937,451[27] | 2,167,961 | ||
| Sapporo | |
 |
1,918,096[27] | 2,584,880 | ||
| Islamabad | |
 |
1,900,000[151] | 2,200,000 | 1,829,180 | |
| Tainan | |
 |
1,885,252[152] | 1,170,000[153] | ||
| Bucharest | |
 |
1,883,425 | 2,272,163[154] | 1,931,000[155] | |
| Curitiba | |
 |
1,879,355 | 3,400,000 | ||
| Shiraz | |
 |
1,869,001 | |||
| Vienna | |
 |
1,863,881 | 2,600,000 | ||
| Brazzaville | |
 |
1,827,000 | |||
| Bhopal | |
.jpg) |
1,798,218[156] | 1,864,389 | 1,745,333 | |
| Hamburg | |
|
1,787,408[157] | 5,046,182 | ||
| Manila | |
 |
1,780,148[117] | 12,877,253[117] | 24,123,000 | |
| Kuala Lumpur | |
 |
1,768,000[158] | 7,200,000[159] | ||
| Maputo | |
 |
1,766,184 | 1,766,823 | ||
| Budapest | |
 |
1,759,407[160] | 2,927,944[161] | 3,303,786 | |
| Warsaw | |
 |
1,753,977[162] | 3,100,844[161] | ||
| Lusaka | |
|
1,742,979 | 2,467,467 | ||
| Kathmandu | |
 |
1,744,240 | 2,517,023 | ||
| Tabriz | |
 |
1,733,033[163] | |||
| Palembang | |
|
1,708,413 | |||
| Almaty | |
|
1,703,481 | |||
| Tijuana | |
|
1,696,923 | 1,895,797 | ||
| Patna | |
 |
1,683,200 | 2,231,554 | 2,046,652[164] | |
| Montreal | |
 |
1,649,519 | 4,127,100 | 3,407,963 | |
| Davao City | |
 |
1,632,991[165] | 2,516,216[lower-alpha 10] | ||
| Harare | |
 |
1,606,000 | 1,619,000[166] | ||
| Barcelona | |
 |
1,604,555[167] | 5,375,774 | 4,740,000[168] | |
| Maracaibo | |
|
1,599,940[169] | 3,897,655 | 2,658,355 | |
| Caloocan | |
 |
1,583,978[117][lower-alpha 11] | |||
| Philadelphia | |
 |
1,567,872[170] | 6,069,875[171] | 7,183,479[172] | |
| Novosibirsk | |
 |
1,567,087[173] | |||
| Phoenix | |
 |
1,563,025[174] | 4,574,531 | 3,629,114 | |
| Bulawayo | |
 |
1,050,000 | 1,200,000[175] | ||
| Oran | |
 |
1,560,329[176] | 3,454,078 | ||
| Semarang | |
 |
1,555,984 | 3,183,516 | ||
| Recife | |
 |
1,555,039 | 3,743,854 | ||
| Kobe | |
 |
1,536,499[27][lower-alpha 12] | |||
| Daejeon | |
|
1,535,028 | |||
| Kampala | |
 |
1,507,080 | |||
| Kawasaki | |
 |
1,496,035[27][lower-alpha 13] | |||
| Guadalajara | |
|
1,495,189 | 4,424,252 | ||
| Auckland | |
.jpg) |
1,495,000[177] | 1,614,300[178] | ||
| Vijayawada | |
 |
1,491,202[179] | 5,873,588 | ||
| Fukuoka | |
 |
1,483,052[27] | 5,590,378 | ||
| Kwangju | |
 |
1,477,780[140] | |||
| Porto Alegre | |
 |
1,476,867 | |||
| Kyoto | |
 |
1,474,570[27][lower-alpha 14] | |||
| San Antonio | |
 |
1,469,845[180] | 2,454,061 | ||
| Santa Cruz de la Sierra | |
 |
1,453,549 | 1,749,000 | ||
| Munich | |
|
1,450,381[181] | 2,606,021 | ||
| Kharkov | |
|
1,447,881 [182] | 1,650,000[183] | ||
| Yekaterinburg | |
 |
1,428,042 | |||
| San Diego | |
 |
1,394,928[180] | 3,095,313 | 2,956,746 | |
| Barranquilla | |
 |
1,386,865[184] | 2,370,753[184] | ||
| Milan | |
 |
1,359,905[185] | 3,206,465[lower-alpha 15] | ||
| Ibadan | |
 |
1,338,659 | 2,837,000 | 3,375,000 | |
| Makassar | |
 |
1,338,633 | 1,976,168 | ||
| Córdoba | |
|
1,330,023[186] | 1,528,000 | ||
| Prague | |
 |
1,324,000[187] | |||
| Mandalay | |
.jpg) |
1,319,452[188] | 1,726,889 | ||
| Dallas | |
 |
1,317,929[189] | 7,233,323[190] | 5,121,892[191] | |
| Montevideo | |
 |
1,305,082[192] | 1,947,604 | 1,719,453 | |
| Nizhny Novgorod | |
 |
1,250,619[193] | |||
| Abuja | |
 |
1,235,880 | 6,000,000[194] | 2,440,000 | |
| Calgary | |
 |
1,235,171[195] | 1,214,839 | 1,095,404 | |
| Saitama | |
 |
1,226,656[27][lower-alpha 16] | |||
| Hiroshima | |
.jpg) |
1,196,274 | |||
| Rosario | |
 |
1,193,605[196] | 1,276,000[197] | ||
| Brisbane | |
 |
1,180,285[198] | 2,349,699[199][198] | ||
| Belgrade | |
 |
1,166,763[200] | 1,233,796[200] | 1,659,440[200] | |
| Campinas | |
.jpg) |
1,164,098[201] | 3,094,181[201] | ||
| Ulsan | |
 |
1,163,690[40] | |||
| Omsk | |
 |
1,154,116[202] | |||
| Dakar | |
 |
1,146,053[203] | 2,452,656[203] | ||
| Abu Dhabi | |
 |
1,145,000 | |||
| Monterrey | |
 |
1,130,960 | 4,520,329 | ||
| Tripoli | |
|
1,126,000 | 2,267,000 | 2,325,000 | |
| Rostov-on-Don | |
 |
1,119,900[204] | |||
| T'bilisi | |
.jpg) |
1,118,035[205] | 1,485,293 | ||
| Fez | |
 |
1,112,072[206] | |||
| Birmingham | |
|
1,111,300 | 3,683,000 | 2,440,986 | |
| Yerevan | |
.jpg) |
1,060,138[207] | |||
| Cologne | |
 |
1,057,327[208] | 3,573,500 | ||
| Tunis | |
 |
1,056,247 | 2,643,695 | 2,294,547 | |
See also
Notes
- ↑ Shanghai, Hangzhou, Nanjing, Suzhou, Wuxi, Ningbo, Changzhou, Shaoxing, and urban area of Zhangjiaggang-Jiangyin within the prefecture-level cities of Suzhou and Wuxi are treated as separate urban areas which constitute the Yangtze River Delta economic zone. Huai'an (1,856,000; 148 km2), Xuzhou (1,246,000; 233 km2), Nantong (1,036,000; 233 km2), Lianyungang (985,000; 155 km2), Zhenjiang (983,000; 168 km2), Yancheng (797,000; 207 km2), Huzhou (690,000; 111 km2), Taizhou (in Jiangsu Province; 300,000; 117 km2) and Suqian (220,000; 36 km2), as well as urban areas of Yangzhou (1,593,000; 233 km2) and Gaoyou (180,000; 39 km2) within the prefecture-level city of Yangzhou, urban areas of Kunshan (1,596,000; 492 km2), Changshu (1,139,000; 285 km2) and Taicang (523,000; 117 km2) within the prefecture-level city of Suzhou, urban areas of Cixi (1,200,000; 298 km2) and Yuyao (650,000; 122 km2) within the sub-provincial city of Ningbo, urban areas of Jiaxing (1,044,000; 259 km2) and Tongxiang (510,000; 52 km2) within the prefecture-level city of Jiaxing, urban areas of Wenling (510,000; 52 km2), Jiaojiang (375,000; 41 km2) and Huangyan (200,000; 34 km2) within the prefecture-level city of Taizhou (in Zhejiang Province), urban areas of Zhuji (500,000; 117 km2) and Shangyu (400,000; 158 km2) within the prefecture-level city of Shaoxing, urban areas of Yiwu-Dongyang (925,000; 233 km2), Jinhua (520,000; 186 km2), Yongkang (500,000; 223 km2), Dongyang (260,000; 104 km2) and Lanxi (220,000; 34 km2) within the prefecture-level city of Jinhua, and urban area of Fuyang (450,000; 49 km2) within the sub-provincial city of Hangzhou are also excluded.
- ↑ Lagos consists 16 out of Lagos State's 20 LGA, which excludes: Badagry, Epe, Ibeju-Lekki and Ikorodu.[16][17]
- ↑ Shenzhen, Dongguan and Foshan are all part of the Pearl River Delta, centered on Guangzhou.
- ↑ Shenzhen, Dongguan and Foshan are all part of the Pearl River Delta, centered on Guangzhou.
- ↑ Sum of the 2014 population estimates for the "urban-function core district" and "urban-function extended district" of Chongqing, which were 3,677,600 and 4,512,200 respectively.[55] See also the next note.
- ↑ Shenzhen, Dongguan and Foshan are all part of the Pearl River Delta, centered on Guangzhou.
- ↑ The cities of Yokohama, Kawasaki and Saitama are all part of the Greater Tokyo Area
- ↑ Quezon City and Caloocan City are both under the administration of Metropolitan Manila
- ↑ Rome and its neighbouring comunes are all under the administration of Metropolitan City of Rome Capital
- ↑ Davao City and its neighbouring cities and towns are all under part of Metropolitan Davao
- ↑ Quezon City and Caloocan City are both under the administration of Metropolitan Manila
- ↑ Kyoto and Kobe are both part of the Keihanshin, centered on Osaka.
- ↑ The cities of Yokohama, Kawasaki and Saitama are all part of the Greater Tokyo Area
- ↑ Kyoto and Kobe are both part of the Keihanshin, centered on Osaka.
- ↑ Milan and its neighbouring comunes are all under the administration of Metropolitan City of Milan
- ↑ The cities of Yokohama, Kawasaki and Saitama are all part of the Greater Tokyo Area
References
- 1 2 3 4 5 "SOWC-2012-DEFINITIONS". UNICEF. Retrieved 29 January 2014.
- ↑ "World Urbanization Prospects: The 2007 Revision Population Database". Esa.un.org. Archived from the original on 22 August 2010. Retrieved 26 July 2010.
- ↑ "United Nations Statistics Division – Demographic and Social Statistics". Millenniumindicators.un.org. Retrieved 26 July 2010.
- ↑ Demographic Yearbook 2005, Volume 57. United Nations. 2008. p. 241. ISBN 92-1-051099-2.
- 1 2 World Urbanization Prospects: The 2003 Revision. United Nations. 2004. ISBN 92-1-151396-0.
- ↑ Alexander, Ruth (29 January 2012). "The world's biggest cities: How do you measure them?". BBC News. Retrieved 16 March 2015.
- 1 2 Demographia (January 2015). Demographia World Urban Areas (PDF) (11 ed.). Retrieved 2 March 2015.
- ↑ 2014年上海市国民经济和社会发展统计公报 [Shanghai Economic and Social Development Statistical Bulletin 2014] (in Chinese). Shanghai Bureau of Statistics. 28 February 2015. Retrieved 1 May 2015.
- ↑ "National Development and Reform Commission (NDRC) People's Republic of China". en.ndrc.gov.cn. Retrieved 5 August 2017.
- ↑ Amer, Khawaja (10 June 2013). "Population explosion: Put an embargo on industrialisation in Karachi". The Express Tribune. Retrieved 28 February 2016.
- ↑ Brinkhoff, Thomas. "The Principal Agglomerations of the World". City Population. Retrieved 8 April 2015.
- ↑ 北京市2014年国民经济和社会发展统计公报 [Beijing Economic and Social Development Statistical Bulletin 2014] (in Chinese). Beijing Bureau of Statistics. 12 February 2015. Archived from the original on 1 March 2016. Retrieved 1 May 2015.
- ↑ (Chinese) 国家统计局北京调查总队, "北京市2013年国民经济和社会发展统计公报", 北京市统计局 Archived 10 March 2014 at the Wayback Machine. 13 February 2014.
- ↑ "India: Delhi". citypopulation.de. citypopulation.de. Retrieved 20 October 2015.
- 1 2 3 4 5 6 7 8 9 10 11 12 13 14 15 16 "Provisional Population Totals, Census of India 2011" (PDF). Census of India. Retrieved 18 October 2011.
- ↑ "Population-Lagos State". Lagos State Government. Archived from the original on 18 October 2015. Retrieved 21 February 2016.
- ↑ "Lagos and Its Potentials for Economic Growth". 2 July 2015. Retrieved 26 October 2015.
- ↑ "Population". Lagos State Government. Archived from the original on 18 October 2015. Retrieved 30 March 2015.
- ↑ "Dhaka (Bangladesh): City Districts and Subdistricts - Population Statistics in Maps and Charts". www.citypopulation.de. Retrieved 5 August 2017.
- ↑ "Population & Housing Census-2011" (PDF). Bangladesh Bureau of Statistics. p. 41. Archived from the original (PDF) on 8 December 2015. Retrieved 15 December 2015.
- ↑ "Dhaka Population 2017 - World Population Review". worldpopulationreview.com. Retrieved 5 August 2017.
- ↑ "District Statistics 2011, Dhaka" (PDF). Bangladesh Bureau of Statistics. December 2013. Retrieved 14 May 2015.
- ↑ 2014年广州市国民经济和社会发展统计公报 [Guangzhou Economic and Social Development Statistics Bulletin 2014]. Guangzhou Daily. 2015-03-22. Archived from the original on 2016-03-12. Retrieved 2015-05-01.
- ↑ 统计年鉴2014 [Statistical Yearbook 2014] (in Guangzhou Cantonese). Statistics Bureau of Guangzhou. 7 April 2015. Retrieved 1 May 2015.
- ↑ "统计年鉴". gzstats.gov.cn.
- 1 2 3 4 5 6 7 8 Turkish Statistical Institute – Address Based Population Record System, 2015
- 1 2 3 4 5 6 7 8 9 10 11 "2015 Population Census". Statistics Bureau, Ministry of Internal Affairs and Communications. Retrieved 13 August 2016.
- 1 2 3 "Table 2.10 Population of Three Major Metropolitan Areas". Statistics Bureau of Japan. Retrieved 26 November 2013.
- ↑ "RUSSIA: Moscow". mos.ru.
- 1 2 "2014 Brazilian Cities Population Estimates" (in Portuguese). IBGE. Retrieved 2 October 2014.
- ↑ "IBGE releases population estimates of municipalities in 2016". IBGE. 28 August 2014. Retrieved 4 September 2014.
- 1 2 3 "Shenzhen Statistics". Shenzhen Government Online.
- ↑ "Suzhou (Statistics 2013)" (PDF). Sztjj.gov.cn. Archived from the original (PDF) on 19 April 2014. Retrieved 20 April 2014.
- ↑ "World Urban Areas" (PDF). Demographia. 1 April 2017.
- ↑ "Egypt". citypopulation.de. Retrieved 20 October 2015.
- ↑ "DemographiaWorld Urban Areas – 8th Annual Edition" (PDF). Demographia. April 2012. Retrieved 25 June 2012.
- ↑ "Data Jumlah Penduduk DKI Jakarta (2014)". Dinas Kependudukan dan Pencatatan Sipil Provinsi DKI Jakarta. Retrieved 5 December 2015.
- ↑ "Data Jumlah Penduduk DKI Jakarta (2014)". Data.jakarta.go.id – Jakarta Open Data. Pemerintah Provinsi DKI Jakarta. Retrieved 5 December 2015.
- ↑ "Seoul Statistics.". Seoul Metropolitan Government. Retrieved 1 June 2016.
- 1 2 3 통계표명 : 주민등록 인구통계 (in Korean). Ministry of Government Administration and Home Affairs. Retrieved 4 April 2015.
- ↑ "MEXICO: Mexico City (2014)". CityPopulation.De. Retrieved 15 March 2014.
- ↑ "Proyecciones de la Población de las Zonas Metropolitanas, 2010–2030" (in Spanish). CONAPO. Retrieved 4 September 2014.
- ↑ "PERU: Lima population". La Republica.
- ↑ "PERÚ: ESTIMACIONES Y PROYECCIONES DE POBLACIÓN TOTAL POR SEXO DE LAS PRINCIPALES CIUDADES". Instituto Nacional de Estadistica e Informatica (INEI) (in Spanish). Scribd. March 2012. p. 32. Retrieved 28 October 2015.
- ↑ "Population Estimates for UK, England and Wales, Scotland and Northern Ireland, Mid-2016". ONS. 22 June 2017. Retrieved 16 July 2017.
- 1 2 "Metropolitan regions: Demographic balance and crude rates". Eurostat. Retrieved 26 January 2015.
- ↑ "西安市2015年国民经济和社会发展统计公报". http://www.xatj.gov.cn/. Retrieved 2016-05-12. External link in
|website=(help) - ↑ "4-5各市、县(市、区)常住人口(2013-2014年)-tjsql.com". www.tjsql.com. Retrieved 2016-03-06.
- ↑ Roberts, Sam (24 March 2011). "City Population Barely Grew in the '00s, Census Finds". The New York Times. Retrieved 24 March 2011.
- 1 2 3 "Annual Estimates of the Resident Population: April 1, 2010 to July 1, 2014 – United States – Metropolitan and Micropolitan Statistical Area; and for Puerto Rico more information. 2014 Population Estimates". U.S. Census Bureau, Population Division. Archived from the original on 17 April 2016. Retrieved 28 March 2015.
- 1 2 "Table 1 Population by sex, household type and household by type, average size of private household by region and area: 2010". Statistic tables, NSO website. National Statistics Office. Retrieved 18 September 2012.
- ↑ "Census (2015)" 南京市2015年1%人口抽样调查数据出炉 常住人口823万. Nanjing Municipal Bureru Statistucs. Retrieved 19 January 2015.
- ↑ (Chinese) 南京都市圈统计数据 16 July 2016.
- ↑ "China – Guangdong Province (2010)". GeoHive. Archived from the original on 14 March 2014. Retrieved 14 March 2014.
- ↑ 2014年重庆市国民经济和社会发展统计公报 [Chongqing Economic and Social Development Statistical Bulletin 2014] (in Chinese). Chongqing Bureau of Statistics. 16 March 2015. Archived from the original on 23 May 2015. Retrieved 26 May 2015.
- ↑ 2015年重庆常住人口3016.55万人 继续保持增长态势 [2015年重庆常住人口3016.55万人 继续保持增长态势] (in Mandarin Chinese). Chongqing News. 28 January 2016. Retrieved 13 February 2016.
- ↑ "IRAN: Tehran City (Census 2011)". CITY POPULATION.DE. Retrieved 25 February 2014.
- ↑ وضعیت توسعه شهری ایران نگرانکننده است/ شهرهای اقماری تهران برای فروش حریم مسابقه گذاشتهاند.
- ↑ "2010年沈阳市第六次全国人口普查主要数据公报(Sixth National Population Census of the People's Republic of China". National Bureau of Statistics of China.
- ↑ "Estimaciones de Población 1985 – 2005 y Proyecciones de Población 2005 – 2020 Total Municipal por Área (estimate)". Departamento Administrativo Nacional de Estadística. Retrieved 29 March 2014.
- ↑ Duncan Smith. "World City Populations 1950 – 2030". Retrieved 18 December 2015.
- ↑ "Bright lights, big cities. Urbanisation and the rise of the megacity". economist.com. Retrieved 23 December 2015.
- 1 2 "Average population by province". General Statistics Office Of Vietnam.
- ↑ "HK Population for 2016". Census and Statistics Department (Hong Kong). 27 Feb 2017.
- ↑ "Demographic Statistics of Iraq (2009)". Central Statistical Government of Iraq. Retrieved 5 March 2014.
- ↑ "Cities having population 1 lakh and above" (PDF). censusindia. The Registrar General & Census Commissioner, India. Retrieved 18 October 2011.
- ↑ "湖南省第六次全国人口普查 - 湖南省第六次全国人口普查主要数据公报[1]". Retrieved 29 October 2016.
- ↑ "武汉市2010年第六次全国人口普查主要数据公报 (Main Data from Wuhan 2010 Census)". Wuhan Statistics Bureau. 10 May 2011. Archived from the original on 25 October 2011. Retrieved 31 July 2011.
- ↑ "2013年天津市国民经济和社会发展统计公报数据". Enorth.com.cn. Retrieved 1 March 2014.
- ↑ "Phonebook of Faisalabad.com - White Pages / Yellow Pages". phonebookoftheworld.com. Retrieved 5 August 2017.
- ↑ "ESTIMATIVAS DA POPULAÇÃO RESIDENTE NOS MUNICÍPIOS BRASILEIROS COM DATA DE REFERÊNCIA EM 1º DE JULHO DE 2013" (PDF) (in Portuguese). IBGE. Retrieved 31 August 2013.
- ↑ "佛山2010年第六次全国人口普查主要数据公报[1]". City of Foshan. Retrieved 30 January 2014.
- ↑ Districts of Changcheng, Nanhai, Shunde; see Foshan#Administration
- ↑ "Chile – Santiago (Census 2012)". Archived from the original on 2 March 2014. Retrieved 1 March 2014.
- ↑ "Región Metropolitana de Santiago" (PDF) (in Spanish). Instituto Nacional de Estadísticas. Retrieved 22 December 2012.
- ↑ "Composition of Population (2012)" (PDF). Arriyadh Development Authority. Retrieved 4 March 2014.
- ↑ "Population & Land Area (Mid-Year Estimates)". Statistics Singapore. Archived from the original on 29 November 2015. Retrieved 4 December 2015.
- ↑ "现将汕头市2010年第六次全国人口普查分区县常住人口[2]数据公布如下:". 汕头市2010年第六次全国人口普查 主要数据公报[1]. Retrieved 30 January 2014.
- ↑ "Demographia World Urban Areas (2014)" (PDF). Demographia. Retrieved 11 March 2014.
- ↑ Rosstat. Оценка численности постоянного населения на 1 января 2015 г. (in Russian)
- ↑ "Morocco: Grand Casablanca – Settat". citypopulation.de. Retrieved 20 October 2015.
- ↑ "Demographia World Urban Areas (2014)" (PDF). Demographia. Retrieved 17 March 2014.
- ↑ 我市2010年第六次全国人口普查数据公报 (in Chinese). Government of Chengdu. 13 May 2011. Archived from the original on 30 September 2011. Retrieved 4 August 2011.
- ↑ "Estimated Population by Governorate". CAPMAS.
- 1 2 3 4 "Census (2011)". Statistics South Africa. Retrieved 23 March 2014.
- ↑ Pinda, Mizengo Peter. "Welcome to the 2012 Tanzania Population and Housing Census WebPage.". Census General Report (pdf); available by clicking “Population Distribution by Administrative Units”. National Bureau of Statistics of Tanzania. Retrieved 28 December 2013.
- ↑ "黑龙江省2010年第六次全国人口普查主要数据公报". National Bureau of Statistics of the People's Republic of China. Retrieved 3 February 2014.
- ↑ All city proper districts except Sōngběi; namely Dàolǐ, Nángǎng, Dàowài, Píngfáng, Xiāngfang; see Harbin#Administrative divisions
- ↑ "EGYPT: Greater Cairo (2006)". citypopulation.de. Retrieved 20 February 2014.
- ↑ Sub-provincial City (Census 2010)
- ↑ "TAIWAN: Administrative Division (Census 2013)". CityPopulation.De. Retrieved 23 March 2014.
- ↑ "Census Estimates (2012)". United States Census Bureau. Archived from the original on 15 August 2014. Retrieved 11 March 2014.
- ↑ "China: Jilin (Prefectures, Cities, Districts and Counties).". Citypopulation.de. Retrieved 5 November 2016.
- ↑ "Demographia World Urban Areas" (PDF). www.demographia.com. Retrieved 27 April 2017.
- ↑ "FASCÍCULO PROVINCIAL GUAYAS" (PDF). INEC Government Website. Retrieved 24 February 2017.
- ↑ 杭州市 2010年国民经济和社会发展统计公报 (in Chinese). Hangzhou Municipal Statistic Bureau. 24 February 2011. Retrieved 15 September 2011.
- ↑ "Xiamen (Sub-provincial city, Fujian)". citypopulation.de. 1 November 2010. Retrieved 4 March 2014.
- ↑ "Population of Berlin(01.01.2014)" (PDF). Statistics Agency Berlin-Brandenburg. Retrieved 3 March 2014.
- ↑ . Retrieved 2 July 2014.
- ↑ "Medellin City Population Census 2013 | Medellin" (in Chinese). Ningbo Municipal Statistic Bureau. 26 January 2010. Retrieved 6 June 2017.
- ↑ "Saudi Census-2010". Central Departament of Statistics Saudi Government. Archived from the original on 1 December 2013. Retrieved 4 March 2014.
- ↑ "Sindh population surges by 81.5 pc, households by 83.9 pc". www.thenews.com.pk. Retrieved 5 August 2017.
- ↑ "Afghanistan (2013)". GeoHive. Archived from the original on 6 August 2014. Retrieved 21 March 2014.
- ↑ "合肥市2010年第六次全国人口普查主要数据公报: 合肥市2010年第六次全国人口普查主要数据公 报[1]". Baidu. Retrieved 15 February 2014.
- ↑ United Nations Statistics Division; Preliminary results of the 2008 Census of Population of the Democratic People’s Republic of Korea conducted on 1–15 October 2008 (pdf-file) Archived 25 March 2009 at the Wayback Machine. Retrieved 1 March 2009.
- ↑ "Municipal Register: Last data published: Population at 1st January (2013)". Instituto Nacional de Estadística (INE – Spain). Retrieved 3 March 2014.
- ↑ "Demographia World Urban Areas, 13th Annual Edition: 2017:04" (PDF).
- ↑ District Profile: Northern Punjab - Rawalpindi Archived 16 May 2008 at the Wayback Machine.
- ↑ "Kenya (Census 2009)". Geohive. Retrieved 3 March 2014.
- ↑ "Archived copy". Archived from the original on 14 March 2014. Retrieved 14 March 2014.
- ↑ http://pcgip.urbanunit.gov.pk/docs/ADPDocumnets/ConsolidatedMultan_ADP.pdf
- ↑ "Population Size of Towns by Sex, Region, Zone and Wereda: July 2013" (PDF). Central Statistical Agency – CSA.
- ↑ "Argentina: Provinces and Agglomerations". citypopulation.de. Retrieved 20 October 2015.
- ↑ "Censo 2010. Resultados provisionales: cuadros y gráficos" (in Spanish). Instituto Nacional de Estadística y Censos (INDEC). Archived from the original on 20 December 2010. Retrieved 22 December 2012.
- 1 2 3 温州市2010年第六次全国人口普查主要数据公报 (in Chinese). Wenzhou Municipal Statistic Bureau. 2011-05-10. Retrieved 2011-08-24.
- ↑ "연령별 인구현황". egov.go.kr.
- 1 2 3 4 Census of Population (2015). "National Capital Region (NCR)". Total Population by Province, City, Municipality and Barangay. PSA. Retrieved 20 June 2016.
- ↑ "Чисельність населення м.Київ". State Statistics Committee. Retrieved 1 July 2016.
- ↑ "Major Agglomerations of the World". www.citypopulation.de. Retrieved 1 April 2013.
- ↑ "População residente, por situação do domicílio e sexo – Aglomerados urbanos – Brasil". Brazilian Institute of Geography and Statistics. Retrieved 12 June 2014.
- 1 2 Confira o ranking das maiores regiões metropolitanas (in Portuguese)
- ↑ "Istat official population estimates". Retrieved 16 April 2017.
- ↑ Bilancio demografico Anno 2014 (dati provvisori). Provincia: Roma – Demo.istat.it
- ↑ "Angola (2014)".
- ↑ "高雄市政府主計處全球資訊網 - 首頁". dbaskmg.kcg.gov.tw (in Chinese). Retrieved 6 June 2016.
- ↑ "INDIA: Uttar Pradesh". City Population. Retrieved 2 June 2017.
- ↑ "INDIA: Uttar Pradesh". City Population. Retrieved 2 June 2017.
- ↑ "Population of Indonesian Administrative Divisions". City Population. Retrieved 21 October 2015.
- 1 2 "Indonesia: Java (Regencies, Cities and Districts) - Population Statistics in Maps and Charts". www.citypopulation.de. Retrieved 5 August 2017.
- ↑ http://www.kalselprov.go.id/berita/konsep-metropolitan-banjar-bakula-akhirnya-diakui-pusat
- ↑ "臺中市政府民政局 ::: 人口統計管理平台 :::". demographics.taichung.gov.tw (in Chinese). Retrieved 6 June 2016.
- ↑ "Demographia World Urban Areas PDF (April 2016)" (PDF). Demographia. Retrieved 6 June 2016.
- ↑ "Basrah" (PDF). UN Joint Analysis Unit. Archived (PDF) from the original on 26 September 2015. Retrieved 2 June 2017.
- ↑ "鄉鎮市區人口及按都會區統計.". Ministry of the Interior (Republic of China). 2013. Archived from the original on 29 March 2014.
- ↑ http://pu.edu.pk/images/journal/csas/PDF/V_26_No_2_9Dr.%20Asad%20Ali%20Khan.pdf
- ↑ "Census Estimates (2014)". United States Census Bureau. Archived from the original on 29 November 2014. Retrieved 20 June 2016.
- ↑ "Population & Housing Census-2011: Union Statistics" (PDF). Bangladesh Bureau of Statistics. p. 39. Archived from the original (PDF) on 8 December 2015. Retrieved 15 December 2015.
- ↑ "Estimativa Populacional 2013" (PDF). Pesquisa Demográfica por Amostra de Domicílios 2011 (in Portuguese). Codeplan. 9 November 2012. Retrieved 6 June 2015.
- ↑ Ibge.gov.br. Retrieved 14 September 2014.
- 1 2
- ↑ "Annual Estimates of the Resident Population for Incorporated Places of 50,000 or More, Ranked by July 1, 2015 Population: April 1, 2010 to July 1, 2015 – United States – Places of 50,000+ Population. 2015 Population Estimates". U.S. Census Bureau, Population Division. Archived from the original on 17 April 2016. Retrieved 26 July 2016.
- 1 2 "World Gazetteer". Archived from the original on 11 January 2013.
- ↑ "Medellin City Population Census 2013 | Medellin".
- ↑ "Nagpur City Population Census 2011 | Maharashtra". www.census2011.co.in. Retrieved 24 February 2017.
- ↑ "Departamento Administrativo Nacional de Estadisticas (Spanish)" (PDF). Retrieved 24 June 2010.
- 1 2 "Instituto Nacional de Estadística (in Spanish)." (PDF).
Archived from the original PDF on 25 June 2014.
- ↑ "2012 Official Census" (PDF).
- 1 2 "Citypopulation.de". Thomas Brinkhoff. Retrieved 25 April 2017.
- ↑ "Key Facts on VMR" (PDF). Visakhapatnam Urban Development Authority. pp. 44–45. Retrieved 21 December 2015.
- ↑ Численность населения на 1 января 2016 г. и среднегодовая численность населения за 2015 год по Республике Беларусь в разрезе областей, районов, городов и поселков городского типа (in Russian)
- ↑ "Islamabad The Capital of Pakistan". islamabadthecapital.com. Retrieved 14 March 2016.
- ↑ "台南市統計月報" (PDF) (in Chinese). Retrieved 13 June 2016.
- ↑ "Demographia World Urban Areas PDF (April 2016)" (PDF). Demographia. Retrieved 13 June 2016.
- ↑ "Population by age groups and sex - larger urban zone". Eurostat. Retrieved 30 July 2015.
- ↑ "Official data for 2011 census" (in Romanian). INSSE. 4 July 2013. Retrieved 4 July 2013.
- ↑ "State population" (PDF). Office of the Registrar General & Census Commissioner. Retrieved 10 June 2016.
- ↑ "State population". Portal of the Land Statistics Office Hamburg. Retrieved 29 December 2015.
- ↑ "Population by States and Ethnic Group". Department of Information, Ministry of Communications and Multimedia, Malaysia. 2015. Archived from the original on 12 February 2016. Retrieved 12 February 2015.
- ↑ "KL on track to megacity status". Focus Malaysia. Retrieved 30 April 2015.
- ↑ "Population by type of settlement – annually". Hungarian Central Statistical Office. 12 April 2016. Retrieved 12 April 2016.
- 1 2 "Functional Urban Areas – Population on 1 January by age groups and sex". Eurostat. 1 April 2016. Retrieved 12 April 2016.
- ↑ "Population by type of settlement – annually". Statistical Office in Warsaw. 31 December 2016. Retrieved 31 December 2016.
- ↑ "نتايج سرشماري - جمعيت و خانوار به ترتيب استان، شهرستان". Statistical Center of Iran.
- ↑ "Urban Agglomerations/Cities having population 1 lakh and above" (PDF). Office of the Registrar General & Census Commissioner, India. Retrieved 2 June 2017.
- ↑ Census of Population (2015). "Region XI (Davao Region)". Total Population by Province, City, Municipality and Barangay. PSA. Retrieved 20 June 2016.
- ↑ "World Urban Areas" (PDF). Demographia. Retrieved 24 November 2013.
- ↑ "Ajuntament de Barcelona". Generalitat of Catalonia. Retrieved 13 November 2015.
- ↑ Demographia: World Urban Areas – Demographia, 2016
- ↑ "Estado Zulia. Municipio Maracaibo. Población estimada por municipios y parroquias, al 30 de junio, 1990-2015". Internet Archive Wayback Machine. Retrieved 3 March 2016.
- ↑ "Annual Estimates of the Resident Population for Incorporated Places of 50,000 or More, Ranked by July 1, 2015 Population". United States Census Bureau. Retrieved January 9, 2017.
- ↑ "Estimates of Resident Population Change and Rankings: July 1, 2014 to July 1, 2015 - United States -- Metropolitan Statistical Area; and for Puerto Rico". U.S. Census Bureau. Retrieved January 9, 2017.
- ↑ "Estimates of Resident Population Change and Rankings: July 1, 2014 to July 1, 2015 - United States -- Combined Statistical Area; and for Puerto Rico". U.S. Census Bureau. Retrieved January 8, 2017.
- ↑ "Численность населения по муниципальным районам и городским округам Новосибирской области на 1 января 2015 года и в среднем за 2014 год" (PDF). Novosibirsk Oblast Territorial Branch of the Federal State Statistics Service. Retrieved 2 June 2017.
- ↑ "American FactFinder". United States Census Bureau. Retrieved 18 June 2014.
- ↑ . Demographia. Retrieved 11 August 2017. https://books.google.co.za/books?id=dsMG4K_G17UC&pg=RA1-PA168&lpg=RA1-PA168&dq=bulawayo+correct+population+1200000&source=bl&ots=A6hJXCSmxF&sig=D5dXHhfdUEz879bM9jHeFA0fxLM&hl=en&sa=X&ved=0ahUKEwjsqu3Ess_VAhVsDcAKHUdzBT4Q6AEIOzAE#v=onepage&q=bulawayo%20correct%20population%201200000&f=false. Missing or empty
|title=(help) - ↑ "ALGERIA: People's Democratic Republic of Algeria". Citypopulation.de. Retrieved 12 May 2014.
- ↑ "Subnational Population Estimates: At 30 June 2016 (provisional)". Statistics New Zealand.
- ↑ "Subnational population estimates (UA, AU), by age and sex, at 30 June 1996, 2001, 2006–16 (2017 boundary)". Statistics New Zealand.
- ↑ "Urban Agglomerations/Cities having population 1 lakh and above" (PDF). Census of India 2011. p. 10.
- 1 2 "One Million Milestone". U.S. Census Bureau. Retrieved October 2015. Check date values in:
|access-date=(help) - ↑ "Muenchen in Zahlen". Retrieved 29 December 2015.
- ↑ "Чисельність населення (щомісячна інформація)". Central Directorate of Statistics of Kharkov region. 1 April 2017. Retrieved 15 June 2017.
- ↑ "Major Agglomerations of the World". www.citypopulation.de. 1 January 2017. Retrieved 15 June 2017.
- 1 2 "Resident population by age, nationality and borough". Alcaldía de Barranquilla - City Hall of Barranquilla (Spanish).
- ↑ "Resident population by age, nationality and borough". City of Milan – Statistical Department.
- ↑ "INDEC: estimaciones de población" (PDF). Archived from the original (PDF) on 9 April 2014. Retrieved 22 April 2014.
- ↑ "Prague Population 2017 - World Population Review". worldpopulationreview.com. Retrieved 5 August 2017.
- ↑ Census Report. The 2014 Myanmar Population and Housing Census. 2. Naypyitaw: Ministry of Immigration and Population. May 2015. p. 57. Retrieved 26 April 2017.
- ↑ Bureau, US Census. "The South Is Home to 10 of the 15 Fastest-Growing Large Cities". Retrieved 5 August 2017.
- ↑ "Dallas Bureau of Economic Analysis". Bureau of Economic Analysis. Retrieved 8 May 2017.
- ↑ "United States Urban Areas". United States Census Bureau. Retrieved 8 May 2017.
- ↑ "The 2011 Census".
- ↑ "ВПН-2010". www.gks.ru. Retrieved 5 August 2017.
- ↑ Editor, Online (29 March 2016). "FCT Minister Harps on Development of Satellite Towns". Retrieved 5 August 2017.
- ↑ "Census Profile: Calgary, Alberta (Population Centre)" (PDF). Statistics Canada. 1 April 2016. Retrieved 5 February 2017.
- ↑ "Provincia de Santa Fe, departamento Rosario. Población total por país de nacimiento, según sexo y grupo de edad. Año 2010." (PDF). INDEC.
- ↑ "Encuesta Permanente de Hogares. Resultados del segundo trimestre de 2012" (PDF). INDEC. Archived from the original (PDF) on 29 October 2013.
- 1 2 "Brisbane (C) Local Government Area community profile". Retrieved 17 April 2017.
- ↑ "2011 Census Community Profiles: Brisbane". ABS Census. Australian Bureau of Statistics. Retrieved 15 September 2016.
- 1 2 3 "2011 Census of Population, Households and Dwellings in the Republic of Serbia: Comparative Overview of the Number of Population in 1948, 1953, 1961, 1971, 1981, 1991, 2002 and 2011, Data by settlements" (PDF). Statistical Office of Republic Of Serbia, Belgrade. 2014. ISBN 978-86-6161-109-4. Retrieved 2014-06-27.
- 1 2 IBGE. "IBGE - sala de imprensa - notícias". saladeimprensa.ibge.gov.br. Retrieved 5 August 2017.
- ↑ "ВПН-2010". www.gks.ru. Retrieved 5 August 2017.
- 1 2 UN Data. Projection based on 2002 census.
- ↑ "(Russian)" (PDF). Retrieved 5 August 2017.
- ↑ "Preliminary Results of 2014 General Population Census of Georgia" (PDF). NATIONAL STATISTICS OFFICE OF GEORGIA. Retrieved 30 April 2015.
- ↑ Morocco 2014 Census
- ↑ "Armstat" (PDF). Retrieved 5 August 2017.
- ↑ "Muenchen in Zahlen". Landesbetrieb Information und Technik NRW (in German). Retrieved 18 July 2016.
External links
- UNSD Demographics Statistics – City population by sex, city and city type
- Nordpil World Database of Large Urban Areas, 1950–2050