Kennington (UK Parliament constituency)
| Kennington | |
|---|---|
|
Former Borough constituency for the House of Commons | |
| 1885–1950 | |
| Number of members | one |
| Replaced by | Vauxhall and Brixton |
| Created from | Lambeth |
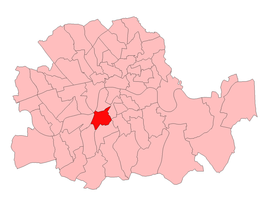
Kennington was a borough constituency centred on the Kennington district of South London. It returned one Member of Parliament (MP) to the House of Commons of the Parliament of the United Kingdom.
The constituency was created for the 1885 general election, and abolished for the 1950 general election.

Kennington in London 1885-1918

Kennington in London 1918-49

Members of Parliament
Election results
Elections in the 1940s
| Party | Candidate | Votes | % | ± | |
|---|---|---|---|---|---|
| Labour | Charles Gibson | 12,910 | 70.2 | ||
| Conservative | S.H. Stanley | 5,471 | 29.8 | ||
| Majority | 7,439 | 40.4 | |||
| Turnout | 29,529 | 62.2 | |||
| Labour gain from Conservative | Swing | ||||
Elections in the 1930s
| Party | Candidate | Votes | % | ± | |
|---|---|---|---|---|---|
| Labour | John Wilmot | 10,715 | 60.1 | +11.2 | |
| Conservative | A. Kennedy | 7,119 | 39.9 | -11.2 | |
| Majority | 3,596 | 20.2 | |||
| Turnout | 43,907 | 40.6 | |||
| Labour gain from Conservative | Swing | ||||
| Party | Candidate | Votes | % | ± | |
|---|---|---|---|---|---|
| Conservative | George Harvey | 12,401 | 51.1 | ||
| Labour | Leonard Matters | 11,856 | 48.9 | ||
| Majority | 545 | 2.2 | |||
| Turnout | 43,583 | 55.7 | |||
| Conservative hold | Swing | ||||
| Party | Candidate | Votes | % | ± | |
|---|---|---|---|---|---|
| Conservative | George Harvey | 18,371 | 64.3 | ||
| Labour | Leonard Matters | 10,188 | 35.7 | ||
| Majority | 8,183 | 28.6 | |||
| Turnout | 46,600 | 61.3 | |||
| Conservative gain from Labour | Swing | ||||
Elections in the 1920s
| Party | Candidate | Votes | % | ± | |
|---|---|---|---|---|---|
| Labour | Leonard Matters | 15,477 | 55.7 | +12.0 | |
| Unionist | George Harvey | 12,328 | 44.3 | -12.0 | |
| Majority | 3,149 | 11.4 | 24.0 | ||
| Turnout | 46,290 | 60.1 | -10.2 | ||
| Labour gain from Unionist | Swing | +12.0 | |||
| Party | Candidate | Votes | % | ± | |
|---|---|---|---|---|---|
| Unionist | George Harvey | 14,898 | 56.3 | ||
| Labour | Thomas Williams | 11,572 | 43.7 | ||
| Majority | 3,326 | 12.6 | |||
| Turnout | 37,629 | 70.3 | |||
| Unionist gain from Labour | Swing | ||||
| Party | Candidate | Votes | % | ± | |
|---|---|---|---|---|---|
| Labour | Thomas Williams | 8,292 | 39.2 | +3.1 | |
| Unionist | Reginald Blair | 7,782 | 36.8 | -10.5 | |
| Liberal | Thomas Jacobsen | 5,075 | 24.0 | +7.4 | |
| Majority | 510 | 2.4 | 13.6 | ||
| Turnout | 36,729 | 57.6 | -0.8 | ||
| Labour gain from Unionist | Swing | +6.8 | |||

Gosling
| Party | Candidate | Votes | % | ± | |
|---|---|---|---|---|---|
| Unionist | Francis Harrison | 10,081 | 47.3 | ||
| Labour | Harry Gosling | 7,670 | 36.1 | ||
| National Liberal | Henry Purchase | 3,522 | 16.6 | ||
| Majority | 2,411 | 11.2 | |||
| Turnout | 36,451 | 58.4 | |||
| Unionist gain from Coalition Liberal | Swing | ||||
Elections in the 1910s

Purchase
| Party | Candidate | Votes | % | ± | |
|---|---|---|---|---|---|
| Liberal | 4,705 | 42.4 | |||
| Unionist | Alice Lucas | 3,573 | 32.2 | ||
| Labour | William Glennie | 2,817 | 25.4 | ||
| Majority | 1,132 | 10.2 | |||
| Turnout | 37,322 | 29.7 | |||
| Liberal hold | Swing | ||||
- Coalition Government endorsed

Collins
| Party | Candidate | Votes | % | ± | |
|---|---|---|---|---|---|
| Liberal | Stephen Collins | 3,565 | 47.6 | ||
| Conservative | Francis Lucas | 3,510 | 46.9 | ||
| Independent Labour | Victor Grayson | 408 | 5.5 | ||
| Majority | 55 | 0.7 | |||
| Turnout | |||||
| Liberal hold | Swing | -2.0 | |||
| Party | Candidate | Votes | % | ± | |
|---|---|---|---|---|---|
| Liberal | Stephen Collins | 4,246 | 52.3 | ||
| Conservative | Francis Lucas | 3,865 | 47.7 | ||
| Majority | 381 | 4.6 | |||
| Turnout | |||||
| Liberal hold | Swing | -8.0 | |||
Elections in the 1900s

Collins
| Party | Candidate | Votes | % | ± | |
|---|---|---|---|---|---|
| Liberal | Stephen Collins | 4,639 | 60.3 | +24.8 | |
| Conservative | Frederick Cook | 3,054 | 39.7 | -24.8 | |
| Majority | 1,585 | 20.6 | |||
| Turnout | 10,382 | 74.1 | |||
| Liberal gain from Conservative | Swing | +24.8 | |||
| Party | Candidate | Votes | % | ± | |
|---|---|---|---|---|---|
| Conservative | Frederick Cook | 4,195 | 64.5 | ||
| Liberal | Walter Essex | 2,309 | 35.5 | ||
| Majority | 1,886 | 29.0 | |||
| Turnout | 10,432 | 62.3 | |||
| Conservative hold | Swing | +7.7 | |||
Elections in the 1890s
| Party | Candidate | Votes | % | ± | |
|---|---|---|---|---|---|
| Conservative | Frederick Cook | 3,764 | 51.8 | ||
| Liberal | Mark Beaufoy | 2,769 | 38.1 | ||
| Independent Liberal | W. Wightman | 730 | 10.1 | ||
| Majority | 995 | 13.7 | |||
| Turnout | 10,117 | 71.8 | |||
| Conservative gain from Liberal | Swing | +11.2 | |||
| Party | Candidate | Votes | % | ± | |
|---|---|---|---|---|---|
| Liberal | Mark Beaufoy | 3,860 | 54.3 | ||
| Conservative | Ferdinand Begg | 3,253 | 45.7 | ||
| Majority | 607 | 8.6 | |||
| Turnout | 9,348 | 76.1 | |||
| Liberal hold | Swing | +0.1 | |||
Elections in the 1880s
| Party | Candidate | Votes | % | ± | |
|---|---|---|---|---|---|
| Liberal | Mark Beaufoy | 4,069 | 54.2 | ||
| Conservative | P.B. Beresford-Hope | 3,439 | 45.8 | ||
| Majority | 630 | 8.4 | |||
| Turnout | 8,920 | 84.2 | |||
| Liberal gain from Conservative | Swing | +7.8 | |||
| Party | Candidate | Votes | % | ± | |
|---|---|---|---|---|---|
| Conservative | Robert Gent-Davis | 3,222 | 53.6 | ||
| Liberal | Mark Beaufoy | 2,792 | 46.4 | ||
| Majority | 430 | 7.2 | |||
| Turnout | 8,313 | 72.3 | |||
| Conservative hold | Swing | +0.8 | |||
| Party | Candidate | Votes | % | ± | |
|---|---|---|---|---|---|
| Conservative | Robert Gent-Davis | 3,351 | 52.6 | ||
| Liberal | John O'Connor Power | 2,991 | 46.9 | ||
| Social Democratic Federation | John Fielding | 32 | 0.5 | ||
| Majority | 360 | 5.7 | |||
| Turnout | 8,313 | 76.7 | |||
References
- Craig, F. W. S. (1983) [1969]. British parliamentary election results 1918-1949 (3rd ed.). Chichester: Parliamentary Research Services. ISBN 0-900178-06-X.
- Leigh Rayment's Historical List of MPs – Constituencies beginning with "K" (part 1)
This article is issued from
Wikipedia.
The text is licensed under Creative Commons - Attribution - Sharealike.
Additional terms may apply for the media files.