Kent County Council election, 2017
| |||||||||||||||||||||||||||||||||||||||||||||||
All 81 seats to Kent County Council 41 seats needed for a majority | |||||||||||||||||||||||||||||||||||||||||||||||
| |||||||||||||||||||||||||||||||||||||||||||||||
|
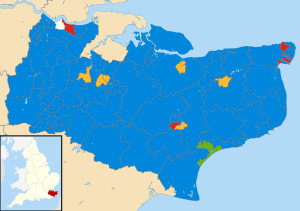
Map showing the results of the 2017 Kent County Council elections. | |||||||||||||||||||||||||||||||||||||||||||||||
| |||||||||||||||||||||||||||||||||||||||||||||||
The 2017 Kent County Council election was held on 4 May 2017 as part of the 2017 local elections in the United Kingdom.[1] All 81 councillors were elected, from 72 electoral divisions, each of which returned either one or two county councillors by first-past-the-post voting for a four-year term of office.
Ward boundary changes took effect at this election, after a review of the county by the Local Government Boundary Commission for England.[2][3]
Kent saw a large turnover of councillors. Of the 81 councillors elected in 2017, 39 had not served in the previous council.
The Conservative Party retained control.
UKIP, previously the second largest party on the council lost all of their seats.
Liberal Democrats regained status as the second largest party, which they had been 2009-2013. A notable triumph for Liberal Democrats was Antony Hook winning the Faversham division, which had been considered a "safe" Conservative seat. Antony Hook's campaign increased the Liberal Democrat vote share from 4% in 2013 to a winning 43%. Faversham also saw the largest turnout of any seat.
Labour lost seats, including those of their Leader Roger Truelove and previous leaders Gordon Cowan and Dr. Mike Eddy. Labour vote share also fell but they retained status as 3rd party.
Results
| Kent County Council election, 2017 | ||||||||||
|---|---|---|---|---|---|---|---|---|---|---|
| Party | Seats | Gains | Losses | Net gain/loss | Seats % | Votes % | Votes | +/− | ||
| Conservative | 67 | 24 | 1 | +23 | 82.71 | 50 | | |||
| Liberal Democrat | 7 | 1 | 1 | 0 | 8.64 | 14 | | |||
| Labour | 5 | 0 | 8 | -8 | 6.17 | 19 | | |||
| Green | 1 | 0 | 0 | 0 | 1.23 | 5 | | |||
| Swanscombe and Greenhithe Residents Association | 1 | 0 | 0 | 0 | 1.23 | <1 | - | |||
| UKIP | 0 | 0 | 17 | -17 | 0 | 10 | | |||
Results by district
Tonbridge and Malling
There are five single-member constituencies and one multi-member constituency within the District of Tonbridge and Malling, which elect a total of seven councillors to Kent County Council. Below are the results:[4]
| Party | Candidate | Votes | % | ± | |
|---|---|---|---|---|---|
| Conservative | Harry Rayner | 3,208 | 69% | | |
| Liberal Democrat | Nicholas George Stapleton | 460 | 10% | | |
| Labour | Kathleen Maria Garlick | 336 | 7% | | |
| Green | Richard Paul Mountford | 312 | 7% | | |
| UKIP | Mike Jerrom | 311 | 7% | | |
| Majority | 2,748 | 59% | — | ||
| Turnout | 4,627 | 36% | | ||
| Conservative hold | Swing | ||||
References
- ↑ "Upcoming elections & referendums". Electoral Commission. Retrieved 16 September 2016.
- ↑ "The Kent (Electoral Changes) Order 2016". legislation.gov.uk. Retrieved 16 September 2016.
- ↑ "Kent County Council". Local Government Boundary Commission for England. Retrieved 16 September 2016.
- ↑ https://shareweb.kent.gov.uk/Documents/council-and-democracy/elections/persons%20nominated/nominations-ton-mallling.pdf
