History of Bristol City Council
Bristol City Council is a unitary authority and ceremonial county in England. Originally formed on 1 April 1974 as a non-metropolitan district as a result of the Local Government Act 1972 (with initial elections taking place in 1973). It was envisaged that Bristol would share power with Avon County Council, an arrangement that lasted until 1996 when it was made into a unitary authority by the Local Government Commission for England, which abolished the county of Avon and gave Bristol City Council control of Avon Council's responsibilities.
Since 2012 Bristol has had a directly elected mayor, who acts as an executive branch separate from elected councillors.
Elected mayors
The position of mayor of Bristol was created following the English mayoral referendum on 4 May 2012, in which Bristol was the only city to vote in favour of introducing an elected mayor. The first mayoral election was held in November, being won by George Ferguson.
| Year | Party | Mayor | |
|---|---|---|---|
| May 2016–present | Labour | Marvin Rees | |
| November 2012 – May 2016 | Independent (as Bristol 1st) | George Ferguson | |
Council control
A single party must occupy more than half of the councillor seats to have control. It is possible for a party to control the council without a majority, such as when Labour councillors dissolved their coalition with the Liberal Democrats in February 2009, leaving the Liberal Democrats to form a minority leadership.[1]
| Year | Controlling party | Notes | |
|---|---|---|---|
| 2016–present | Labour | ||
| 2011–2016 | No Overall Control | ||
| 2009–2011 | Liberal Democrats | ||
| 2003–2009 | No Overall Control | ||
| 1986–2003 | Labour | Council changed to a unitary authority in 1995. | |
| 1983–1986 | No Overall Control | ||
| 1973–1983 | Labour | ||
Council composition
| Year | Labour | Conservative | Lib Dems | Green | UKIP | Independent | Notes | ||||||
|---|---|---|---|---|---|---|---|---|---|---|---|---|---|
| May 2016 | 37 | 14 | 8 | 11 | Ward boundaries changed.[2][3] | ||||||||
| 21 May 2015 | 30 | 16 | 9 | 14 | 1 | Fi Hance (Redland) defected from the Liberal Democrats to the Green Party.[4] | |||||||
| 7 May 2015 | 30 | 16 | 10 | 13 | 1 | ||||||||
| March 2015 | 31 | 16 | 16 | 6 | 1 | Jason Budd (Kingsweston), formerly independent, joined the Conservative Party.[5] | |||||||
| May 2014 | 31 | 15 | 16 | 6 | 1 | 1 | |||||||
| May 2013 | 28 | 14 | 23 | 4 | 1 | ||||||||
| September 2011 | 22 | 14 | 32 | 2 | Southmead by-election. | ||||||||
| May 2011 | 21 | 14 | 33 | 2 | |||||||||
| May 2010 | 17 | 14 | 38 | 1 | |||||||||
| May 2009 | 16 | 17 | 36 | 1 | |||||||||
| October 2008 | 24 | 13 | 32 | 1 | St George West by-election triggered due to the death of one of the sitting councillors. | ||||||||
| May 2007 | 25 | 13 | 31 | 1 | |||||||||
| May 2006 | 23 | 13 | 33 | 1 | |||||||||
| May 2005 | 27 | 11 | 32 | ||||||||||
| May 2004 | 31 | 11 | 28 | Lawrence Hill by-election. | |||||||||
| May 2003 | 31 | 11 | 28 | ||||||||||
| May 2002 | 36 | 10 | 24 | ||||||||||
| June 2001 | 40 | 9 | 21 | ||||||||||
| October 2000 | 36 | 10 | 24 | Southville by-election. | |||||||||
| February 2000 | 36 | 10 | 24 | Lockleaze by-election. | |||||||||
| May 1999 | 37 | 10 | 23 | Ward boundaries changed. Number of seats available increased from 68 to 70.[6] | |||||||||
| June 1998 | 45 | 6 | 17 | Ashley by-election. | |||||||||
| May 1998 | 46 | 6 | 16 | ||||||||||
| March 1998 | 50 | 5 | 13 | Cabot by-election. | |||||||||
| June 1997 | 50 | 5 | 13 | Brislington West by-election. | |||||||||
| May 1997 | 51 | 5 | 12 | ||||||||||
| May 1995 | 53 | 6 | 9 | Council changed from a non-metropolitan district to a unitary authority. | |||||||||
| May 1994 | 41 | 19 | 8 | ||||||||||
| May 1992 | 40 | 22 | 6 | ||||||||||
| May 1991 | 45 | 18 | 5 | ||||||||||
| May 1990 | 43 | 21 | 4 | ||||||||||
| May 1988 | 39 | 24 | 5 | ||||||||||
| May 1987 | 37 | 25 | 6 | ||||||||||
| May 1986 | 35 | 26 | 7 | ||||||||||
| May 1984 | 33 | 29 | 6 | City boundaries were changed but the number of seats stayed the same.[7] | |||||||||
| May 1983 | 30 | 32 | 6 | Ward boundaries changed. Number of seats available decreased from 84 to 68.[8] | |||||||||
| May 1979 | 53 | 28 | 3 | ||||||||||
| May 1976 | 47 | 34 | 3 | ||||||||||
| June 1973 | 56 | 25 | 3 | Formation of the Bristol non-metropolitan district, with 84 available seats. | |||||||||
Council election result maps
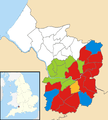
 2016 results map
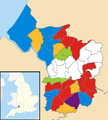
 2015 results map
 2014 results map
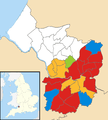
 2013 results map
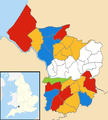
 2011 results map
 2010 results map
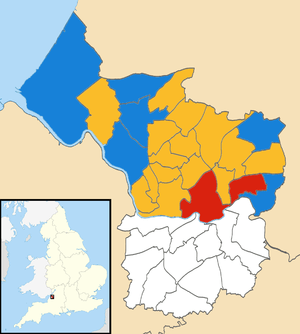 2009 results map
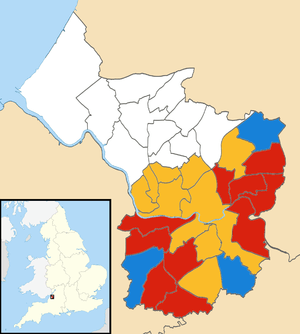 2007 results map
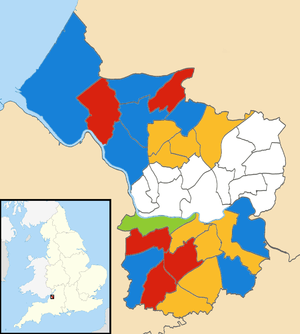 2006 results map
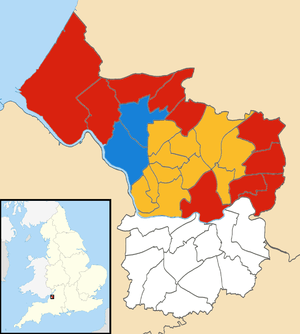 2005 results map
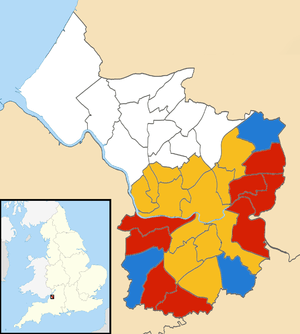 2003 results map
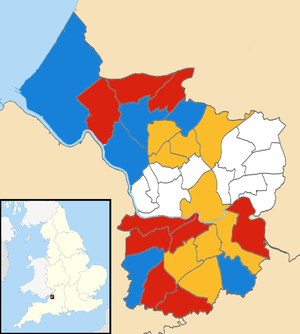 2002 results map
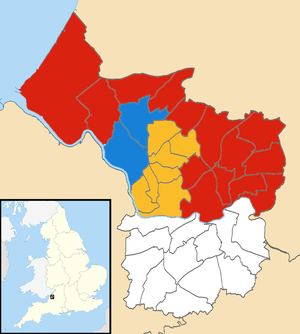 2001 results map
 1999 results map
 1998 results map
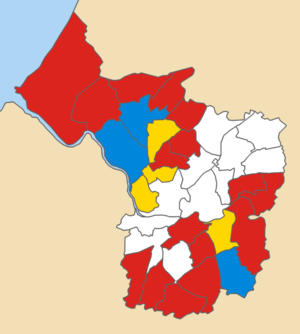 1997 results map
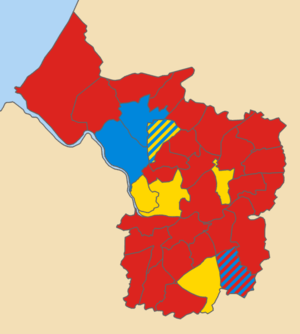 1995 results map
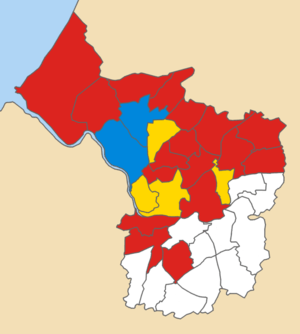 1994 results map
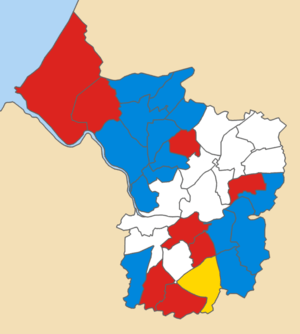 1992 results map
 1991 results map
 1990 results map
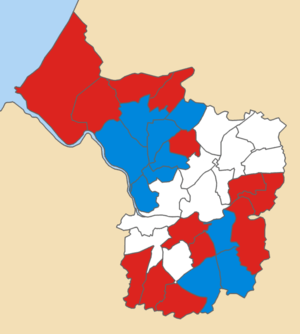 1988 results map
 1987 results map
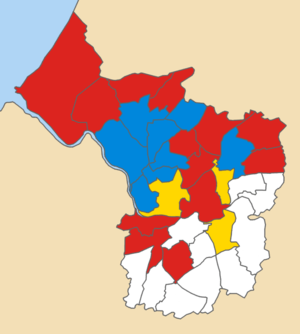 1986 results map
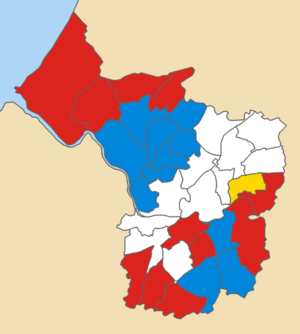 1984 results map
 1983 results map
See also
References
- ↑ "Lib Dems take over Bristol City Council". Bristol Evening Post. 24 February 2009. Retrieved 10 May 2016.
- ↑ legislation.gov.uk – The Bristol (Electoral Changes) Order 2015. Retrieved 20 April 2016.
- ↑ "Bristol all-out council elections approved by councillors".
- ↑ Emanuel, Louis (22 May 2015). "Greens gain a councillor as Lib Dem defects". Bristol 24/7. Retrieved 9 May 2016.
- ↑ Onions, Ian (12 March 2015). "Bristol's only Independent councillor joins Tories". Bristol Post. Retrieved 9 May 2016.
- ↑ legislation.gov.uk – The City of Bristol (Electoral Changes) Order 1998. Retrieved 4 October 2015.
- ↑ The Bristol, Wansdyke and Woodspring (Areas) Order 1984
- ↑ The City of Bristol (Electoral Arrangements) Order 1980