High Peak (UK Parliament constituency)

High Peak
County constituency
for the House of Commons

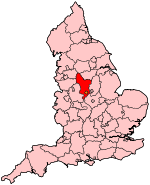
Outline map

Boundary of High Peak in Derbyshire.

Outline map

Location of Derbyshire within England.
County Derbyshire
Electorate 72,178 (December 2010)[1]
Major settlements Buxton, Chapel-en-le-Frith, Glossop
Current constituency
Created 1885
Member of parliament Ruth George (Labour)
Number of members One
Created from North Derbyshire
Overlaps
European Parliament constituency East Midlands

High Peak is a constituency[n 1] represented in the House of Commons of the UK Parliament since 2017 by Ruth George, from the Labour Party.[n 2]

Boundaries

1885–1918: The Municipal Borough of Glossop, and the Sessional Divisions of Buxton, Chapel-en-le-Frith, and Glossop.

1918–1950: The Municipal Boroughs of Buxton and Glossop, the Urban District of New Mills, the Rural Districts of Glossop Dale and Hayfield, and parts of the Rural Districts of Bakewell and Chapel-en-le-Frith.

1950–1983: The Municipal Boroughs of Buxton and Glossop, the Urban Districts of New Mills and Whaley Bridge, and the Rural District of Chapel-en-le-Frith.

1983–2010: The Borough of High Peak, and the District of West Derbyshire wards of Bradwell, Hathersage and Tideswell.

2010–present: The Borough of High Peak.

The constituency covers much of northern Derbyshire and represents most of the west of the Peak District which encircles Buxton and Glossop.[2] Crowden, Tintwistle and Woodhead (formerly within the boundaries of Cheshire and in the Stalybridge and Hyde constituency) were brought into the seat in the boundary changes for the 1983 general election. The constituency boundaries became co-terminous with the local government district at the 2010 general election.

Constituency profile

Areas around the Hope Valley have a Conservative majority, whereas the north western part of the constituency, in Glossop (especially the Manchester overspill estate of Gamesley), Hadfield and Tintwistle, are more Labour-inclined. Buxton is often divided between the two main parties. The seat has considerable connections with Manchester (and the Hope Valley with Sheffield), rather than the East Midlands.

History

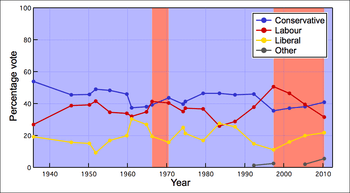
The seat was created in the Redistribution of Seats Act 1885. Since 1910 the seat has returned a Conservative MP apart from during three periods. A Labour Party representative was elected for the first time in 1966, but lost it at the next general election. Labour next won the seat at the 1997 landslide general election and held it at the other two general elections during the Blair ministry, but it was regained by the Conservatives at the 2010 election. It returned to Labour at the 2017 general election when Ruth George gained the seat, the first time Labour held High Peak without winning the general election overall in its history.

Members of Parliament

ElectionMember[3]Party
1885 William Sidebottom[4] Conservative
1900 Oswald Partington[5] Liberal
December 1910 Samuel Hill-Wood[6] Unionist
1929 Alfred Law[7] Unionist
1939 by-election Hugh Molson[8] Conservative
1961 by-election David Walder[9] Conservative
1966 Peter Jackson[10] Labour
1970 Spencer Le Marchant[11] Conservative
1983 Christopher Hawkins[12] Conservative
1992 Charles Hendry[13] Conservative
1997 Tom Levitt[14] Labour
2010 Andrew Bingham[15] Conservative
2017 Ruth George Labour

Elections

Historical election results for High Peak

Elections in the 2010s

General Election 2017: High Peak
Party Candidate Votes % ±
Labour Ruth George[16] 26,753 49.7 +14.4
Conservative Andrew Bingham[17] 24,431 45.4 +0.4
Liberal Democrat Charles Lawley[18] 2,669 5.0 +0.3
Majority 2,322 4.3
Turnout 54,018 73.75 +4.25[19]
Labour gain from Conservative Swing +7.0
General Election 2015: High Peak[20][21]
Party Candidate Votes % ±
Conservative Andrew Bingham 22,836 45.0 +4.1
Labour Caitlin Bisknell 17,942 35.3 +3.7
UKIP Ian Guiver 5,811 11.4 +8.0
Liberal Democrat Stephen Worrall 2,389 4.7 −17.1
Green Charlotte Farrell 1,811 3.6 +1.8
Majority 4,894 9.6 +0.3
Turnout 50,789 69.5 −0.4
Conservative hold Swing +0.2
General Election 2010: High Peak[22][23]
Party Candidate Votes % ±
Conservative Andrew Bingham 20,587 40.9 +3.6
Labour Caitlin Bisknell 15,910 31.6 −9.5
Liberal Democrat Alistair Stevens 10,993 21.8 +2.4
UKIP Sylvia Hall 1,690 3.4 +1.2
Green Peter Allen 922 1.8 N/A
Independent Lance Dowson 161 0.3 N/A
Independent Tony Alves 74 0.1 N/A
Majority 4,677 9.3
Turnout 50,337 69.9 +3.8
Conservative gain from Labour Swing +6.55

Elections in the 2000s

General Election 2005: High Peak[24]
Party Candidate Votes % ±
Labour Tom Levitt 19,809 39.6 −7.0
Conservative Andrew Bingham 19,074 38.2 +0.9
Liberal Democrat Marc Godwin 10,000 20.0 +3.9
UKIP Michael Schwarz 1,106 2.2 N/A
Majority 735 1.5
Turnout 49,989 66.4
Labour hold Swing -3.95
General Election 2001: High Peak[25]
Party Candidate Votes % ±
Labour Tom Levitt 22,430 46.6 −4.2
Conservative Simon Chapman 17,941 37.3 +1.8
Liberal Democrat Peter Ashenden 7,743 16.1 +4.9
Majority 4,489 9.3
Turnout 48,114 65.2 −13.7
Labour hold Swing −3.0

Elections in the 1990s

General Election 1997: High Peak[26]
Party Candidate Votes % ±
Labour Tom Levitt 29,052 50.8
Conservative Charles Hendry 20,261 35.5
Liberal Democrat Sue Barber 6,420 11.2
Referendum Colin Hanson-Orr 1,420 2.5
Majority 8,791 15.4
Turnout 57,153 78.9
Labour gain from Conservative Swing
General Election 1992: High Peak[27][28]
Party Candidate Votes % ±
Conservative Charles Hendry 27,538 46.0 +0.3
Labour Tom Levitt 22,719 37.9 +9.1
Liberal Democrat Simon P. Molloy 8,861 14.8 −10.8
Green Roger Floyd 794 1.3 +1.3
Majority 4,819 8.0 −8.9
Turnout 59,912 84.6 +4.1
Conservative hold Swing −4.4

Elections in the 1980s

General Election 1987: High Peak[29]
Party Candidate Votes % ±
Conservative Christopher Hawkins 25,715 45.67 −0.7
Labour Jean McCrindle 16,199 28.8 +2.7
Social Democratic John Oldham 14,389 25.6 −2.0
Majority 9,516 16.9 −1.9
Turnout 56,303 80.5 +2.0
Conservative hold Swing
General Election 1983: High Peak[30]
Party Candidate Votes % ±
Conservative Christopher Hawkins 24,534 46.4 −0.1
Social Democratic David Marquand 14,594 27.6 +10.7
Labour David Wilcox 13,755 26.0 −10.6
Majority 9,940 18.8 +9.0
Turnout 52,883 78.5 −3.3
Conservative hold Swing

Elections in the 1970s

General Election 1979: High Peak[31]
Party Candidate Votes % ±
Conservative Spencer Le Marchant 22,532 46.5
Labour David Bookbinder 17,777 36.7
Liberal D. Brown 8,200 16.9
Majority 4,755 9.8
Turnout 81.8
Conservative hold Swing
General Election October 1974: High Peak[32]
Party Candidate Votes % ±
Conservative Spencer Le Marchant 19,043 41.4
Labour David Bookbinder 17,041 37.1
Liberal Christopher Walmsley 9,875 21.5
Majority 2,002 4.4
Turnout 80.5
Conservative hold Swing
General Election February 1974: High Peak[33]
Party Candidate Votes % ±
Conservative Spencer Le Marchant 19,231 39.8
Labour Peter Jackson 16,956 35.1
Liberal Nora Scott 12,117 25.1
Majority 2,275 4.7
Turnout 85.4
Conservative hold Swing
General Election 1970: High Peak[34]
Party Candidate Votes % ±
Conservative Spencer Le Marchant 19,558 43.7
Labour Peter Jackson 18,054 40.4
Liberal Dennis Wrigley 7,119 15.9
Majority 1,504 3.4
Turnout 80.8
Conservative gain from Labour Swing

Elections in the 1960s

General Election 1966: High Peak[35]
Party Candidate Votes % ±
Labour Peter Jackson 16,938 41.3
Conservative David Walder 16,124 39.3
Liberal Dennis Wrigley 7,990 19.5
Majority 814 2.0
Turnout 84.2
Labour gain from Conservative Swing
General Election 1964: High Peak[36]
Party Candidate Votes % ±
Conservative David Walder 15,753 38.1
Labour John Roper 14,416 34.9
Liberal Dennis Wrigley 11,147 27.0
Majority 1,337 3.2
Turnout 85.3
Conservative hold Swing
High Peak by-election, 1961[37]
Party Candidate Votes % ±
Conservative David Walder 13,069 37.4 -8.6
Labour Wilfred McCormack Halsall 11,201 32.1 -1.9
Liberal Dennis Wrigley 10,674 30.5 +10.5
Majority 1,868 5.3 -6.8
Turnout 34,944
Conservative hold Swing

Elections in the 1950s

General Election 1959: High Peak[38]
Party Candidate Votes % ±
Conservative Hugh Molson 18,738 46.0
Labour Bernard Conlan 13,827 34.0
Liberal Stephen R. Cawley 8,138 20.0
Majority 4,911 12.1
Turnout 82.7
Conservative hold Swing
General Election 1955: High Peak[39][40]
Party Candidate Votes % ±
Conservative Hugh Molson 19,094 48.4
Labour Neil McBride 13,652 34.6
Liberal Stephen R. Cawley 6,712 17.0
Majority 5,442 13.8
Turnout 79.5
Conservative hold Swing
General Election 1951: High Peak[41]
Party Candidate Votes % ±
Conservative Hugh Molson 21,305 49.0
Labour Wilfred McCormack Halsall 18,127 41.7
Liberal Stephen R. Cawley 4,070 9.4
Majority 3,178 7.3
Turnout 85.9
Conservative hold Swing
General Election 1950: High Peak[42]
Party Candidate Votes % ±
Conservative Hugh Molson 19,740 45.7
Labour Wilfred McCormack Halsall 16,933 39.2
Liberal Tom Stuttard Rothwell 6,539 15.1
Majority 2,807 6.5
Turnout 85.8
Conservative hold Swing

Elections in the 1940s

General Election 1945: High Peak[43]
Party Candidate Votes % ±
Conservative Hugh Molson 18,113 45.5
Labour Wilfred McCormack Halsall 15,454 38.8
Liberal Tom Stuttard Rothwell 6,230 15.7
Majority 2,659 6.7
Turnout 77.8
Conservative hold Swing

Elections in the 1930s

At the High Peak by-election, 1939, Hugh Molson was elected unopposed.

General Election 1935: High Peak[44]
Party Candidate Votes % ±
Conservative Alfred Law 19,145 53.9
Labour R. W. Wright 9,559 26.9
Liberal Leonard Radcliffe 6,831 19.2
Majority 9,586 27.00
Turnout 72.2
Conservative hold Swing
General Election 1931: High Peak[45]
Party Candidate Votes % ±
Conservative Alfred Law 27,577 74.1
Labour George Bagnall 9,640 25.9
Majority 17,937 48.2
Turnout 37,217
Conservative hold Swing

Elections in the 1920s

General Election 1929: High Peak [45]
Party Candidate Votes % ±
Unionist Alfred Law 16,406 43.1 -10.2
Liberal Robert McDougall 11,083 29.1 -17.6
Labour George Bagnall 10,567 27.8 n/a
Majority 5,323 14.0 +7.4
Turnout 80.9 +4.1
Unionist hold Swing +3.7
General Election 1924: High Peak[45]
Party Candidate Votes % ±
Unionist Samuel Hill-Wood 14,560 53.3
Liberal Robert McDougall 12,772 46.7
Majority 1,788 6.6
Turnout 27,332 76.8
Unionist hold Swing
General Election 1923: High Peak
Party Candidate Votes % ±
Unionist Samuel Hill-Wood 12,162 44.6 -1.2
Liberal Robert McDougall 9,432 34.6 +7.5
Labour Frank Anderson 5,684 20.8 -6.3
Majority 2,730 10.0 -15.4
Turnout 78.2 -4.7
Unionist hold Swing -4.4
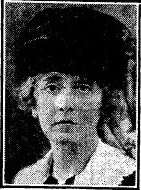
Lady Barlow
General Election 1922: High Peak
Party Candidate Votes % ±
Unionist Samuel Hill-Wood 14,892 52.5 -6.3
Labour Frank Anderson 7,698 27.1 n/a
Liberal Anna Barlow 5,802 20.4
Majority 7,194 25.4
Turnout 82.9 +20.6
Unionist hold Swing

Election results 1885–1918

Elections in the 1880s
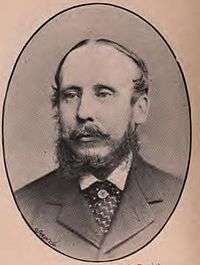
Sidebottom
General Election 1885: High Peak [46][47][48]
Party Candidate Votes % ±
Conservative William Sidebottom 4,199 n/a
Liberal John Frederick Cheetham 4,190 n/a
Majority 9 n/a
Turnout 89.1 n/a
Conservative win (new seat)
General Election 1886: High Peak [46][47]
Party Candidate Votes % ±
Conservative William Sidebottom 4,162
Liberal H Rhodes 4,001
Majority 161
Turnout 86.7
Conservative hold Swing

Elections in the 1890s

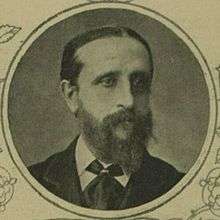
Cheetham
General Election 1892: High Peak [46][47]
Party Candidate Votes % ±
Conservative William Sidebottom 4,609
Liberal John Frederick Cheetham 4,243
Majority 366
Turnout 79.6
Conservative hold Swing
General Election 1895: High Peak [46][47][49]
Party Candidate Votes % ±
Conservative William Sidebottom 4,671
Liberal Arthur Gibb Symonds 4,164
Majority 507
Turnout 85.0
Conservative hold Swing

Elections in the 1900s

General Election 1900: High Peak [46][47][49]
Party Candidate Votes % ±
Liberal Oswald Partington 4,591
Conservative Samuel Roberts 4,432
Majority 159
Turnout 86.6
Liberal gain from Conservative Swing
General Election 1906: High Peak [46][47]
Party Candidate Votes % ±
Liberal Oswald Partington 5,450 53.9
Conservative Albert Profumo 4,662 46.1
Majority 788 7.8 +6.0
Turnout 90.7 +4.1
Liberal hold Swing
Partington
High Peak by-election, 1909
Party Candidate Votes % ±
Liberal Oswald Partington 5,619 51.5
Conservative Albert Profumo 5,272 48.4
Majority 347 3.2
Turnout 91.1
Liberal hold Swing

Elections in the 1910s

General Election January 1910: High Peak [46][50]
Party Candidate Votes % ±
Liberal Oswald Partington 5,912 50.5 -1.1
Conservative Samuel Hill-Wood 5,806 49.5 +1.1
Majority 1.0 -2.2
Turnout 94.4 +3.3
Liberal hold Swing -1.1
General Election December 1910: High Peak [46][51]
Party Candidate Votes % ±
Conservative Samuel Hill-Wood 5,813 50.8 +0.3
Liberal Oswald Partington 5,629 49.2 -0.3
Turnout 11,442 92.2
Majority 184 1.6 +0.6
Conservative hold Swing +0.3

General Election 1914/15:

Another General Election was required to take place before the end of 1915. The political parties had been making preparations for an election to take place and by the July 1914, the following candidates had been selected;

General Election 1918: High Peak
Party Candidate Votes % ±
Unionist 12,118
Liberal Clifford Brookes 8,504
Majority
Turnout
Unionist hold Swing

See also

Notes and references

References

  1. "Electorate Figures – Boundary Commission for England". 2011 Electorate Figures. Boundary Commission for England. 4 March 2011. Archived from the original on 6 November 2010. Retrieved 13 March 2011.
  2. "Map of Peak District National Park". Retrieved 27 October 2015.
  3. Leigh Rayment's Historical List of MPs – Constituencies beginning with "H" (part 3)
  4. "Mr William Sidebottom, former MP, High Peak". TheyWorkForYou. Retrieved 27 October 2015.
  5. By-Elections in British Politics, 1832–1914. Boydell Press. 2013. p. 258.
  6. Cooper, Glynis (2015). Glossop in the Great War. Pen and Sword. p. 29.
  7. "The Announcement..." (PDF). The British Journal of Nursing. 085: 231. September 1937. Retrieved 27 October 2015.
  8. Hazlehurst, Cameron; Whitehead, Sally; Woodland, Christine (1996). A Guide to the Papers of British Cabinet Ministers 1900–1964. Cambridge University Press. p. 269.
  9. "Mr David Walder". Hansard. UK Parliament. Retrieved 27 October 2015.
  10. "Mr Peter Jackson". Hansard. UK Parliament. Retrieved 27 October 2015.
  11. Skinner, Dennis (2014). Sailing Close to the Wind: Reminiscences. Hachette UK. p. 85. ISBN 1784291234.
  12. "Mr Christopher Hawkins". Hansard. UK Parliament. Retrieved 27 October 2015.
  13. "Charles Hendry". politics.co.uk. Retrieved 27 October 2015.
  14. Carr, Sue (18 November 2009). "MP Tom Levitt to step down". Retrieved 27 October 2015.
  15. "Andrew Bingham MP, High Peak". TheyWorkForYou. Retrieved 27 October 2015.
  16. Hayes, Dan (3 May 2017). "GENERAL ELECTION: High Peak Labour pick local union campaigner". Buxton Advertiser. Retrieved 9 May 2017.
  17. Dodds, Jonathan (21 April 2017). "Conservative MP Andrew Bingham to defend High Peak seat in general election". Derbyshire Times. Retrieved 9 May 2017.
  18. Ball, Lucy (6 May 2017). "Liberal Democrats announce High Peak candidate for general election". Buxton Advertiser. Retrieved 9 May 2017.
  19. Higgins, Adam (9 June 2017). "High drama in High Peak as Labour take control". Glossop Chronicle. Retrieved 9 June 2017.
  20. "Election Data 2015". Electoral Calculus. Archived from the original on 17 October 2015. Retrieved 4 March 2017.
  21. "High Peak Parliamentary Constituency – Election 2015". BBC News.
  22. "Election Data 2010". Electoral Calculus. Archived from the original on 17 November 2015. Retrieved 4 March 2017.
  23. "High Peak Parliamentary Constituency – Election 2010". BBC News.
  24. "Election Data 2005". Electoral Calculus. Archived from the original on 15 October 2011. Retrieved 4 March 2017.
  25. "Election Data 2001". Electoral Calculus. Archived from the original on 15 October 2011. Retrieved 4 March 2017.
  26. "Election Data 1997". Electoral Calculus. Archived from the original on 15 October 2011. Retrieved 4 March 2017.
  27. "Election Data 1992". Electoral Calculus. Archived from the original on 15 October 2011. Retrieved 4 March 2017.
  28. "Politics Resources". Election 1992. Politics Resources. 9 April 1992. Retrieved 6 December 2010.
  29. "Election Data 1987". Electoral Calculus. Archived from the original on 15 October 2011. Retrieved 4 March 2017.
  30. "Election Data 1983". Electoral Calculus. Archived from the original on 15 October 2011. Retrieved 4 March 2017.
  31. "Politics Resources". Election 1979. Politics Resources. Retrieved 27 October 2015.
  32. "Politics Resources". Election October 1974. Politics Resources. Retrieved 27 October 2015.
  33. "Politics Resources". Election February 1974. Politics Resources. Retrieved 27 October 2015.
  34. "Politics Resources". Election 1970. Politics Resources. Retrieved 27 October 2015.
  35. "Politics Resources". Election 1966. Politics Resources. Retrieved 27 October 2015.
  36. "Politics Resources". Election 1964. Politics Resources. Retrieved 27 October 2015.
  37. 1961 by Election Results
  38. "Politics Resources". Election 1959. Politics Resources. Retrieved 27 October 2015.
  39. "Politics Resources". Election 1955. Politics Resources. Retrieved 27 October 2015.
  40. The Times' Guide to the House of Commons. 1955.
  41. "Politics Resources". Election 1951. Politics Resources. Retrieved 27 October 2015.
  42. "Politics Resources". Election 1950. Politics Resources. Retrieved 27 October 2015.
  43. "Politics Resources". Election 1945. Politics Resources. Retrieved 27 October 2015.
  44. "Politics Resources". Election 1935. Politics Resources. Retrieved 27 October 2015.
  45. 1 2 3 The Constitutional Year Book 1938, p.230
  46. 1 2 3 4 5 6 7 8 British Parliamentary Election Results 1885–1918, FWS Craig
  47. 1 2 3 4 5 6 The Liberal Year Book, 1907
  48. Debrett's House of Commons & Judicial Bench, 1886
  49. 1 2 Debrett's House of Commons & Judicial Bench, 1901
  50. Debrett's House of Commons & Judicial Bench, 1916
  51. Derbyshire Courier, 4 Aug 1914
Notes
  1. A county constituency (for the purposes of election expenses and type of returning officer)
  2. As with all constituencies, the constituency elects one Member of parliament (MP) by the first past the post system of election at least every five years.

Coordinates: 53°21′N 1°51′W / 53.35°N 1.85°W / 53.35; -1.85
This article is issued from Wikipedia. The text is licensed under Creative Commons - Attribution - Sharealike. Additional terms may apply for the media files.