Tropical rainforest climate
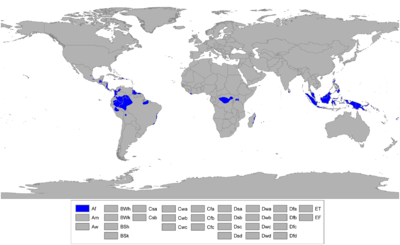
Worldwide zones of Tropical rainforest climate (Af).
A tropical rainforest climate, also known as an equatorial climate, is a tropical climate usually (but not always) found along the equator. Regions with this climate typically feature tropical rainforests, and it is designated Af by the Köppen climate classification.
Description
Tropical rainforests have a type of tropical climate in which there is no dry season—all months have an average precipitation value of at least 60 mm (2.4 in). Tropical rainforests have no summer or winter; it is typically hot and wet throughout the year and rainfall is both heavy and frequent. One day in an equatorial climate can be very similar to the next, while the change in temperature between day and night may be larger than the average change in temperature along the year.[1]
Distribution

Upland rainforest in Borneo. Sabah, Malaysia
A tropical rainforest climate is usually found at latitudes within 10 degrees North and South of the equator, which are dominated by the Intertropical Convergence Zone. The climate is most commonly found in South America, Central Africa, and Southeast Asia. However, tropical rainforest microclimates are found in many other regions (e.g., far North Queensland), while not everywhere along the equatorial region features a tropical rainforest climate.
Some of the places that have this rainforests are indeed uniformly and monotonously wet throughout the year (e.g., the northwest Pacific coast of South and Central America, from Ecuador to Costa Rica, see for instance, Andagoya, Colombia), but in many cases the period of higher sun and longer days is distinctly driest (as at Palembang, Indonesia) or the time of lower sun and shorter days may have more rain (as at Sitiawan, Malaysia).
Additionally, while tropical rainforest climates are typically located near the equator (hence the alternate name “equatorial climate”), there are a number of instances where the climate is found some distance away from the equator. For instance, Santos, Brazil and Fort Lauderdale, United States are not only far removed from the equator, but are actually located just outside the tropics. Yet both of these cities feature a tropical rainforest climate, albeit with noticeably cooler and warmer periods of the year.
Notable cities with Tropical rainforest climates
|
Africa
North America
-
 Punta Gorda, Belize Punta Gorda, Belize
-
 Limón, Costa Rica Limón, Costa Rica
-
 Higüey, Dominican Republic Higüey, Dominican Republic
-
 Puerto Barrios, Guatemala Puerto Barrios, Guatemala
-
 La Ceiba, Honduras La Ceiba, Honduras
-
 Port Antonio, Jamaica Port Antonio, Jamaica
-
 Bluefields, Nicaragua Bluefields, Nicaragua
-
 Changuinola, Panama Changuinola, Panama
-
 Hilo, United States Hilo, United States
-
 Kapaa, United States Kapaa, United States
-
 Fort Lauderdale, United States Fort Lauderdale, United States
South America
-
 Rurrenabaque, Bolivia Rurrenabaque, Bolivia
-
 Belém, Brazil Belém, Brazil
-
 Macaé, Brazil Macaé, Brazil
-
 Manaus, Brazil Manaus, Brazil
-
 Salvador, Brazil Salvador, Brazil
-
 Florencia, Colombia Florencia, Colombia
-
 Medellín, Colombia Medellín, Colombia
-
 Puyo, Ecuador Puyo, Ecuador
-
 Saint-Laurent-du-Maroni, French Guiana Saint-Laurent-du-Maroni, French Guiana
-
 Georgetown, Guyana Georgetown, Guyana
-
 Iquitos, Peru Iquitos, Peru
-
 Paramaribo, Suriname Paramaribo, Suriname
-
 Santa Elena de Uairén, Venezuela Santa Elena de Uairén, Venezuela
|
Asia
-
 Bandar Seri Begawan, Brunei Bandar Seri Begawan, Brunei
-
 Ambon, Indonesia Ambon, Indonesia
-
 Banda Aceh, Indonesia Banda Aceh, Indonesia
-
 Biak, Indonesia Biak, Indonesia
-
 Bogor, Indonesia Bogor, Indonesia
-
 Medan, Indonesia Medan, Indonesia
-
 Padang, Indonesia Padang, Indonesia
-
 Palangkaraya, Indonesia Palangkaraya, Indonesia
-
 Palembang, Indonesia Palembang, Indonesia
-
 Pekanbaru, Indonesia Pekanbaru, Indonesia
-
 Pontianak, Indonesia Pontianak, Indonesia
-
 Samarinda, Indonesia Samarinda, Indonesia
-
 Tanjung Selor, Indonesia Tanjung Selor, Indonesia
-
 Ishigaki, Japan Ishigaki, Japan
-
 Alor Setar, Malaysia Alor Setar, Malaysia
-
 George Town, Malaysia George Town, Malaysia
-
 Ipoh, Malaysia Ipoh, Malaysia
-
 Johor Bahru, Malaysia Johor Bahru, Malaysia
-
 Kota Kinabalu, Malaysia Kota Kinabalu, Malaysia
-
 Kuala Lumpur, Malaysia Kuala Lumpur, Malaysia
-
 Kuala Terengganu, Malaysia Kuala Terengganu, Malaysia
-
 Kuching, Malaysia Kuching, Malaysia
-
 Malacca City, Malaysia Malacca City, Malaysia
-
 Miri, Malaysia Miri, Malaysia
-
 Petaling Jaya, Malaysia Petaling Jaya, Malaysia
-
 Shah Alam, Malaysia Shah Alam, Malaysia
-
 Davao City, Philippines Davao City, Philippines
-
 Polomolok, Philippines Polomolok, Philippines
-
 Tacloban, Leyte, Philippines Tacloban, Leyte, Philippines
-
 Singapore Singapore
-
 Colombo, Sri Lanka Colombo, Sri Lanka
-
 Nakhon Si Thammarat, Thailand Nakhon Si Thammarat, Thailand
-
 Su-ngai Kolok, Thailand Su-ngai Kolok, Thailand
Oceania
|
Examples
| Western Samoa
|
|---|
| Climate chart (explanation) |
|---|
| J | F | M | A | M | J | J | A | S | O | N | D |
|
|
|
|
|
|
|
|
|
|
|
|
| Average max. and min. temperatures in °C |
| Precipitation totals in mm | | Source: |
|
| Imperial conversion |
|---|
| J | F | M | A | M | J | J | A | S | O | N | D |
|
|
|
|
|
|
|
|
|
|
|
|
| Average max. and min. temperatures in °F |
| Precipitation totals in inches |
|
| Paramaribo, Suriname
|
|---|
| Climate chart (explanation) |
|---|
| J | F | M | A | M | J | J | A | S | O | N | D |
|
|
|
|
|
|
|
|
|
|
|
|
| Average max. and min. temperatures in °C |
| Precipitation totals in mm | | Source: |
|
| Imperial conversion |
|---|
| J | F | M | A | M | J | J | A | S | O | N | D |
|
|
|
|
|
|
|
|
|
|
|
|
| Average max. and min. temperatures in °F |
| Precipitation totals in inches |
|
| Mbandaka, DR Congo
|
|---|
| Climate chart (explanation) |
|---|
| J | F | M | A | M | J | J | A | S | O | N | D |
|
|
|
|
|
|
|
|
|
|
|
|
| Average max. and min. temperatures in °C |
| Precipitation totals in mm | | Source: |
|
| Imperial conversion |
|---|
| J | F | M | A | M | J | J | A | S | O | N | D |
|
|
|
|
|
|
|
|
|
|
|
|
| Average max. and min. temperatures in °F |
| Precipitation totals in inches |
|
| Biak, Indonesia
|
|---|
| Climate chart (explanation) |
|---|
| J | F | M | A | M | J | J | A | S | O | N | D |
|
|
|
|
|
|
|
|
|
|
|
|
| Average max. and min. temperatures in °C |
| Precipitation totals in mm | | Source: |
|
| Imperial conversion |
|---|
| J | F | M | A | M | J | J | A | S | O | N | D |
|
|
|
|
|
|
|
|
|
|
|
|
| Average max. and min. temperatures in °F |
| Precipitation totals in inches |
|
| Kuching, Malaysia
|
|---|
| Climate chart (explanation) |
|---|
| J | F | M | A | M | J | J | A | S | O | N | D |
|
|
|
|
|
|
|
|
|
|
|
|
| Average max. and min. temperatures in °C |
| Precipitation totals in mm | | Source: Monthly Statistical Bulletin Sarawak |
|
| Imperial conversion |
|---|
| J | F | M | A | M | J | J | A | S | O | N | D |
|
|
|
|
|
|
|
|
|
|
|
|
| Average max. and min. temperatures in °F |
| Precipitation totals in inches |
|
| Quibdó, Colombia
|
|---|
| Climate chart (explanation) |
|---|
| J | F | M | A | M | J | J | A | S | O | N | D |
|
|
|
|
|
|
|
|
|
|
|
|
| Average max. and min. temperatures in °C |
| Precipitation totals in mm | | Source: |
|
| Imperial conversion |
|---|
| J | F | M | A | M | J | J | A | S | O | N | D |
|
|
|
|
|
|
|
|
|
|
|
|
| Average max. and min. temperatures in °F |
| Precipitation totals in inches |
|
See also
References
- ↑ McKnight, Tom L; Hess, Darrel (2000), "Climate Zones and Types", Physical Geography: A Landscape Appreciation, Upper Saddle River, NJ: Prentice Hall, pp. 205–8, ISBN 0-13-020263-0
|
|---|
| Class A | |
|---|
| Class B | |
|---|
| Class C | |
|---|
| Class D |
- Humid continental (Dfa, Dwa, Dfb, Dwb, Dsa, Dsb)
- Subarctic (Dfc, Dwc, Dfd, Dwd, Dsc, Dsd)
|
|---|
| Class E | |
|---|

