Enfield Southgate (UK Parliament constituency)
| Enfield Southgate | |
|---|---|
|
Borough constituency for the House of Commons | |
|
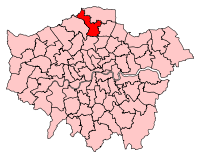
Boundary of Enfield Southgate in Greater London. | |
| County | Greater London |
| Electorate | 64,932 (December 2010)[1] |
| Current constituency | |
| Created | 1950 |
| Member of parliament | Bambos Charalambous (Labour) |
| Created from | Enfield and Wood Green |
| Overlaps | |
| European Parliament constituency | London |
Enfield Southgate is a constituency[n 1] created in 1950 represented in the House of Commons of the UK Parliament since 2017 by Bambos Charalambous, a member of the Labour Party[n 2]
History
From 1950 to the February 1974 general election, this constituency was known as Southgate.[n 3]
The seat gained national attention in the 1997 general election when Michael Portillo, Secretary of State for Defence was unexpectedly defeated on a massive swing. Portillo had been widely expected to contest the Conservative leadership and his defeat the media took to epitomise the Labour landslide victory. The victorious candidate, Stephen Twigg, increased his majority at the following election. In the 2005 general election, Twigg's majority was the largest overturned, with a swing of 8.7% to the Conservative candidate David Burrowes.
The 2015 result gave the seat the 60th most marginal majority of the Conservative Party's 331 seats by percentage of majority,[2] with Labour gaining the seat in the 2017 general election on a substantial 9.7% swing. Enfield Southgate is one of four constituencies, the others being Croydon Central, Peterborough and Reading East, which elected Labour MPs in 2017 having not done so since 2001.
Constituency profile
The constituency is in the west of the London Borough of Enfield and generally more affluent than other parts of the borough. It is more cosmopolitan than many other Conservative London suburban constituencies including sizeable Jewish, Muslim and Cypriot communities.[n 4]
In recent years, the south-eastern and southern wards of the constituency including Bowes and Palmers Green always return Labour local councillors. These wards tend to give the bulk of the Labour vote. But in the remainder of the wards, they give majorities to the Conservatives and often elect Conservative councillors.[3]
To the north the seat becomes semi-rural as it takes in Trent Park and the former campus of Middlesex University, and the Cockfosters terminus of the Piccadilly line. It stretches into the wealthy Hadley Wood area. Some areas (smaller than local government wards) in the south of the constituency have middle rankings of deprivation when placed in a complete list of wards (such as the 2000 Index of Multiple Deprivation), however all other output areas lack any significant deprivation.[4]
Boundaries
1950–1965: The Municipal Borough of Southgate.
1965–1974: Southgate as part of the London Borough of Enfield.
1974–1983: The London Borough of Enfield wards of Arnos, Bowes, Cockfosters, Grange, Highfield, Oakwood, Palmers Green, Southgate Green, West, and Winchmore Hill.
1983–2010: The London Borough of Enfield wards of Arnos, Bowes, Grange, Grovelands, Highfield, Merryhills, Oakwood, Palmers Green, Southgate Green, Trent, and Winchmore Hill.
2010–present: The London Borough of Enfield wards of Bowes, Cockfosters, Grange, Palmers Green, Southgate, Southgate Green, and Winchmore Hill.
Boundary review
5th Boundary review 2000–2007
Following its review of parliamentary representation in North London, the Boundary Commission for England made some changes to Enfield, Southgate. Part of Highlands ward was transferred to the constituency of Enfield North, and part of Grange ward was transferred from Enfield North to Enfield, Southgate. Parts of Grange ward, Bowes ward and Palmers Green ward were transferred to Enfield, Southgate from Edmonton. Part of Bush Hill Park ward and a tiny part of Upper Edmonton ward were transferred to Edmonton.
6th Boundary review 2015–2018
In the first draft proposal of the Review, the Constituency would be broken up, with Cockfosters Ward joining an enlarged Chipping Barnet, Grange Ward joining Enfield North (renamed to Enfield), Palmers Green returning to Edmonton, and the remainder joining parts of Finchley in a new Southgate and Finchley Constituency.[5]
Members of Parliament
Elections
Elections in the 2010s
| Party | Candidate | Votes | % | ± | |
|---|---|---|---|---|---|
| Labour | Bambos Charalambous | 24,989 | 51.7 | | |
| Conservative | David Burrowes | 20,634 | 42.7 | | |
| Liberal Democrat | Pippa Morgan | 1,925 | 4.0 | | |
| Green | David Flint | 780 | 1.6 | | |
| Majority | 4,355 | 9.0 | N/A | ||
| Turnout | 48,328 | 74.44 | | ||
| Labour gain from Conservative | Swing | |
|||
| Party | Candidate | Votes | % | ± | |
|---|---|---|---|---|---|
| Conservative | David Burrowes | 22,624 | 49.4 | 0.0 | |
| Labour | Bambos Charalambous | 17,871 | 39.0 | +6.8 | |
| UKIP | David Schofield | 2,109 | 4.6 | +3.5 | |
| Green | Jean Robertson-Molloy | 1,690 | 3.7 | +2.3 | |
| Liberal Democrat | Paul Smith | 1,518 | 3.3 | −10.5 | |
| Majority | 4,753 | 10.4 | -6.8 | ||
| Turnout | 45,812 | 70.5 | +1.3 | ||
| Conservative hold | Swing | −3.4 | |||
| Party | Candidate | Votes | % | ± | |
|---|---|---|---|---|---|
| Conservative | David Burrowes | 21,928 | 49.4 | +5.7 | |
| Labour | Bambos Charalambous | 14,302 | 32.2 | −8.8 | |
| Liberal Democrat | Johar Khan | 6,124 | 13.8 | +2.7 | |
| Green | Peter Krakowiak | 632 | 1.4 | −1.4 | |
| UKIP | Bob Brock | 505 | 1.1 | −0.1 | |
| Independent | Asit Mukhopadhyay | 391 | 0.9 | +0.9 | |
| Respect | Samad Billoo | 174 | 0.4 | +0.4 | |
| English Democrat | Ben Weald | 173 | 0.4 | +0.4 | |
| Independent | Mal 'the Warrior' Malakounides | 88 | 0.2 | +0.2 | |
| Better Britain Party | Jeremy Sturgess | 35 | 0.1 | +0.1 | |
| Majority | 7,626 | 17.2 | |||
| Turnout | 44,352 | 69.2 | +5.7 | ||
| Conservative hold | Swing | +7.2 | |||
Elections in the 2000s
| Party | Candidate | Votes | % | ± | |
|---|---|---|---|---|---|
| Conservative | David Burrowes | 18,830 | 44.6 | +6.0 | |
| Labour | Stephen Twigg | 17,083 | 40.5 | −11.3 | |
| Liberal Democrat | Ziz Kakoulakis | 4,724 | 11.2 | +4.2 | |
| Green | Trevor Doughty | 1,083 | 2.6 | +1.0 | |
| UKIP | Brian Hall | 490 | 1.2 | +0.5 | |
| Majority | 1,747 | 4.1 | |||
| Turnout | 42,210 | 66.4 | +2.9 | ||
| Conservative gain from Labour | Swing | +8.7 | |||
| Party | Candidate | Votes | % | ± | |
|---|---|---|---|---|---|
| Labour | Stephen Twigg | 21,727 | 51.8 | +7.6 | |
| Conservative | John Flack | 16,181 | 38.6 | −2.5 | |
| Liberal Democrat | Wayne Hoban | 2,935 | 7.0 | −3.7 | |
| Green | Elaine Graham-Leigh | 662 | 1.6 | N/A | |
| UKIP | Roy Freshwater | 298 | 0.7 | N/A | |
| Independent | Andrew Malakouna | 105 | 0.3 | −0.2 | |
| Majority | 5,546 | 13.2 | +10.1 | ||
| Turnout | 41,908 | 63.5 | −7.1 | ||
| Labour hold | Swing | ||||
Elections in the 1990s
| Party | Candidate | Votes | % | ± | |
|---|---|---|---|---|---|
| Labour | Stephen Twigg | 20,570 | 44.2 | +18.0 | |
| Conservative | Michael Portillo | 19,137 | 41.1 | −16.8 | |
| Liberal Democrat | Jeremy Browne | 4,966 | 10.7 | −3.8 | |
| Referendum | Nicholas Luard | 1,342 | 2.9 | N/A | |
| Christian Democrat | Alan Storkey | 289 | 0.6 | N/A | |
| Mal – Voice of the People | Andrew Malakouna | 229 | 0.5 | N/A | |
| Majority | 1,433 | 3.1 | |||
| Turnout | 46,533 | 70.6 | -5.7 | ||
| Labour gain from Conservative | Swing | +17.4 | |||
| Party | Candidate | Votes | % | ± | |
|---|---|---|---|---|---|
| Conservative | Michael Portillo | 28,422 | 58.0 | −0.8 | |
| Labour | Karen Livney | 12,859 | 26.2 | +7.3 | |
| Liberal Democrat | Kevin Keane | 7,080 | 11.2 | −6.5 | |
| Green | Marghanita C.P.H. Hollands | 696 | 1.4 | 0.0 | |
| Majority | 15,563 | 31.8 | −6.1 | ||
| Turnout | 49,057 | 76.3 | +3.7 | ||
| Conservative hold | Swing | −4.1 | |||
Elections in the 1980s
| Party | Candidate | Votes | % | ± | |
|---|---|---|---|---|---|
| Conservative | Michael Portillo | 28,445 | 58.8 | +0.7 | |
| Liberal | Nick Harvey | 10,100 | 20.9 | −2.5 | |
| Labour | Allan Course | 9,114 | 18.9 | +1.0 | |
| Green | Stephen Rooney | 696 | 1.4 | N/A | |
| Majority | 18,345 | 37.9 | +3.2 | ||
| Turnout | 48,355 | 72.6 | +3.0 | ||
| Conservative hold | Swing | ||||
| Party | Candidate | Votes | % | ± | |
|---|---|---|---|---|---|
| Conservative | Michael Portillo | 16,684 | 49.6 | −8.5 | |
| Liberal | Timothy Slack | 11,973 | 35.6 | +12.2 | |
| Labour | Peter Hamid | 4,000 | 11.9 | −6.0 | |
| Turkish Troops Out of Cyprus | Andreas Polydrou | 687 | 2 | N/A | |
| Nationalist Party | James Kershaw | 80 | 0.2 | N/A | |
| English National | Raymond Shenton | 78 | 0.2 | N/A | |
| Abolish Greater London, Restore Middlesex | Iain Burgess | 50 | 0.2 | N/A | |
| Captain Rainbow's Universal Party | George Weiss | 48 | 0.2 | N/A | |
| Death off Roads: Freight on Rail | Helen Anscomb | 45 | 0.1 | N/A | |
| Majority | 4,711 | 14.0 | -20.7 | ||
| Turnout | 33,645 | 50.6 | -19.0 | ||
| Conservative hold | Swing | −1.3 | |||
| Party | Candidate | Votes | % | ± | |
|---|---|---|---|---|---|
| Conservative | Anthony Berry | 26,451 | 58.09 | −3.5 | |
| Liberal | D Morgan | 10,632 | 23.35 | +9.29 | |
| Labour | Mary Honeyball | 8,132 | 17.86 | −4.7 | |
| BNP | M Braithwaite | 318 | 0.7 | N/A | |
| Majority | 15,819 | 34.74 | |||
| Turnout | 69.58 | ||||
| Conservative hold | Swing | ||||
Elections in the 1970s
| Party | Candidate | Votes | % | ± | |
|---|---|---|---|---|---|
| Conservative | Anthony Berry | 31,663 | 61.64 | +7.74 | |
| Labour | I S Wilson | 11,584 | 22.55 | -0.28 | |
| Liberal | A Baker | 7,223 | 14.06 | -6.6 | |
| National Front | R Pert | 895 | 1.74 | -0.87 | |
| Majority | 20,079 | 39.09 | |||
| Turnout | 76.26 | ||||
| Conservative hold | Swing | ||||
| Party | Candidate | Votes | % | ± | |
|---|---|---|---|---|---|
| Conservative | Anthony Berry | 25,888 | 53.9 | +1.76 | |
| Labour | J P Sheppard | 10,966 | 22.83 | +2.64 | |
| Liberal | George J Bridge | 9,922 | 20.66 | -4.81 | |
| National Front | B W Pell | 1,255 | 2.61 | +0.41 | |
| Majority | 14,922 | 31.07 | |||
| Turnout | 67.71 | ||||
| Conservative hold | Swing | ||||
| Party | Candidate | Votes | % | ± | |
|---|---|---|---|---|---|
| Conservative | Anthony Berry | 28,620 | 52.14 | – | |
| Liberal | George J Bridge | 13,806 | 25.47 | – | |
| Labour | F Sealey | 10,945 | 20.19 | – | |
| National Front | B W Pell | 1,192 | 2.2 | – | |
| Majority | 14,454 | 26.67 | |||
| Turnout | 77.02 | ||||
| Conservative hold | Swing | ||||
| Party | Candidate | Votes | % | ± | |
|---|---|---|---|---|---|
| Conservative | Anthony Berry | 22,963 | 60.74 | ||
| Labour | Robert Brian Bastin | 9,389 | 24.84 | ||
| Liberal | George J Bridge | 5,451 | 14.42 | ||
| Majority | 13,574 | 35.91 | |||
| Turnout | 67.61 | ||||
| Conservative hold | Swing | ||||
Elections in the 1960s
| Party | Candidate | Votes | % | ± | |
|---|---|---|---|---|---|
| Conservative | Anthony Berry | 21,171 | 53.47 | ||
| Labour | Percy Sassoon Gourgey | 9,743 | 24.61 | ||
| Liberal | George J Bridge | 8,679 | 21.92 | ||
| Majority | 11,428 | 28.86 | |||
| Turnout | 75.12 | ||||
| Conservative hold | Swing | ||||
| Party | Candidate | Votes | % | ± | |
|---|---|---|---|---|---|
| Conservative | Anthony Berry | 22,251 | 54.75 | ||
| Liberal | George J Bridge | 9,600 | 23.62 | ||
| Labour | S. John Chapman | 8,787 | 21.62 | ||
| Majority | 12,651 | 31.13 | |||
| Turnout | 76.39 | ||||
| Conservative hold | Swing | ||||
Elections in the 1950s
| Party | Candidate | Votes | % | ± | |
|---|---|---|---|---|---|
| Conservative | Beverley Baxter | 25,704 | 60.79 | ||
| Liberal | George J Bridge | 8,968 | 21.21 | ||
| Labour | S. John Chapman | 7,613 | 18.00 | ||
| Majority | 16,736 | 39.58 | |||
| Turnout | 77.07 | ||||
| Conservative hold | Swing | ||||
| Party | Candidate | Votes | % | ± | |
|---|---|---|---|---|---|
| Conservative | Beverley Baxter | 26,794 | 62.32 | ||
| Labour | George Louis Caunt | 8,584 | 19.97 | ||
| Liberal | George J Bridge | 7,614 | 17.71 | ||
| Majority | 18,210 | 42.36 | |||
| Turnout | 77.12 | ||||
| Conservative hold | Swing | ||||
| Party | Candidate | Votes | % | ± | |
|---|---|---|---|---|---|
| Conservative | Beverley Baxter | 30,044 | 62.16 | ||
| Labour | Vera Dart | 10,889 | 22.53 | ||
| Liberal | Edwin Malindine | 7,402 | 15.31 | ||
| Majority | 19,155 | 39.63 | |||
| Turnout | 84.12 | ||||
| Conservative hold | Swing | ||||
| Party | Candidate | Votes | % | ± | |
|---|---|---|---|---|---|
| Conservative | Beverley Baxter | 30,302 | 61.1 | n/a | |
| Labour | Vera Dart | 11,023 | 22.2 | n/a | |
| Liberal | Gershon Ellenbogen | 8,286 | 16.7 | n/a | |
| Majority | 19,279 | 38.9 | n/a | ||
| Turnout | 86.4 | n/a | |||
| Conservative win | |||||
Graphical representation
| 22.2% | 16.7% | 61.1% |
| Labour | Liberal | Conservative |
| 22.5% | 15.3% | 62.2% |
| Labour | Liberal | Conservative |
| 20.0% | 17.7% | 62.3% |
| Labour | Liberal | Conservative |
| 18.0% | 21.2% | 60.8% |
| Labour | Liberal | Conservative |
| 21.6% | 23.6% | 54.8% |
| Labour | Liberal | Conservative |
| 24.6% | 21.9% | 53.5% |
| Labour | Liberal | Conservative |
| 24.8% | 14.4% | 60.7% |
| Labour | Liberal | Conservative |
| 20.2% | 25.5% | 52.1% | 2.2 |
| Labour | Liberal | Conservative | NF |
| 22.8% | 20.7% | 53.9% | 2.6 |
| Labour | Liberal | Conservative | NF |
| 22.6% | 14.1% | 61.6% | |
| Labour | Liberal | Conservative | N |
| 17.9% | 23.4% | 58.1% | |
| Labour | Liberal | Conservative |
| 11.9% | 35.6% | 2 | 49.6% | |||||
| Labour | Liberal | In | Conservative |
| 18.9% | 20.9% | 58.8% | |
| Labour | Liberal | Conservative |
| 26.2% | 11.2% | 58.0% | |
| Labour | Lib Dems | Conservative |
| 44.2% | 10.7% | 41.1% | 2.9 | ||
| Labour | Lib Dems | Conservative | Ref |
| 51.8% | 7.0% | 38.6% | |||
| Labour | Lib Dem | Conservative |
| 2.6 | 40.5% | 11.2% | 44.6% | |
| Gn | Labour | Lib Dems | Conservative |
| 32.2% | 13.8% | 49.4% | |||||||
| Labour | Lib Dems | Conservative |
| 3.7 | 39.0% | 3.3 | 49.4% | 4.6% |
| Gn | Labour | LD | Conservative | UKIP |
| 1.6 | 51.7% | 4.0 | 42.7% |
| Gn | Labour | LD | Conservative |
See also
Notes and references
- Notes
- ↑ A borough constituency (for the purposes of election expenses and type of returning officer)
- ↑ As with all constituencies, the constituency elects one Member of Parliament (MP) by the first past the post system of election at least every five years.
- ↑ Strictly a London Borough prefix to the constituency name (in this case Enfield) was introduced in 1974
- ↑ see 2011 census data release: Ethnicity
- References
- ↑ "Electorate Figures – Boundary Commission for England". 2011 Electorate Figures. Boundary Commission for England. 4 March 2011. Archived from the original on 6 November 2010. Retrieved 13 March 2011.
- ↑ List of Conservative MPs elected in 2015 by % majority UK Political.info. Retrieved 2017-01-29
- ↑ Enfield — Councillors
- ↑ 2001 Census
- ↑ "UK Boundary Commission draft proposal for London" (PDF). Retrieved 26 April 2017.
- ↑ "Enfield Southgate parliamentary constituency". BBC News.
- ↑ "Election Data 2015". Electoral Calculus. Archived from the original on 17 October 2015. Retrieved 17 October 2015.
- ↑ Election Results for Enfield Southgate
- ↑ "Election Data 2010". Electoral Calculus. Archived from the original on 26 July 2013. Retrieved 17 October 2015.
- ↑ General Election Results from the Electoral Commission
- ↑ "Election Data 2005". Electoral Calculus. Archived from the original on 15 October 2011. Retrieved 18 October 2015.
- ↑ "Election Data 2001". Electoral Calculus. Archived from the original on 15 October 2011. Retrieved 18 October 2015.
- ↑ "Election Data 1997". Electoral Calculus. Archived from the original on 15 October 2011. Retrieved 18 October 2015.
- ↑ "Election Data 1992". Electoral Calculus. Archived from the original on 15 October 2011. Retrieved 18 October 2015.
- ↑ "Election Data 1987". Electoral Calculus. Archived from the original on 15 October 2011. Retrieved 18 October 2015.
- ↑ "Election Data 1983". Electoral Calculus. Archived from the original on 15 October 2011. Retrieved 18 October 2015.
Coordinates: 51°38′49″N 0°07′19″W / 51.647°N 0.122°W