Dutch general election, 1972
| |||||||||||||||||||||||||||||||||||||||||||||||||||||||||||||||||||||||||||||||||||||||||||||||||||||||||||||||||||||||||||||||||
All 150 seats to the House of Representatives 76 seats were needed for a majority | |||||||||||||||||||||||||||||||||||||||||||||||||||||||||||||||||||||||||||||||||||||||||||||||||||||||||||||||||||||||||||||||||
| Turnout | 83.5% | ||||||||||||||||||||||||||||||||||||||||||||||||||||||||||||||||||||||||||||||||||||||||||||||||||||||||||||||||||||||||||||||||
| |||||||||||||||||||||||||||||||||||||||||||||||||||||||||||||||||||||||||||||||||||||||||||||||||||||||||||||||||||||||||||||||||
|
Seats | |||||||||||||||||||||||||||||||||||||||||||||||||||||||||||||||||||||||||||||||||||||||||||||||||||||||||||||||||||||||||||||||||
| |||||||||||||||||||||||||||||||||||||||||||||||||||||||||||||||||||||||||||||||||||||||||||||||||||||||||||||||||||||||||||||||||

.jpg)


.jpg)

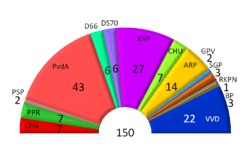
Early general elections were held in the Netherlands on 29 November 1972.[1] The Labour Party (PvdA) remained the largest party, winning 43 of the 150 seats in the House of Representatives.[2]
The elections led to a five-party coalition government consisting of the PvdA, the Catholic People's Party, the Anti-Revolutionary Party, the Political Party of Radicals and Democrats 1966 with the PvdA's Joop den Uyl as Prime Minister.
Results
| Party | Votes | % | Seats | +/– |
|---|---|---|---|---|
| Labour Party | 2,021,454 | 27.3 | 43 | +4 |
| Catholic People's Party | 1,305,401 | 17.7 | 27 | –8 |
| People's Party for Freedom and Democracy | 1,068,375 | 14.4 | 22 | +6 |
| Anti-Revolutionary Party | 653,609 | 8.8 | 14 | –1 |
| Political Party of Radicals | 354,829 | 4.8 | 7 | +5 |
| Christian Historical Union | 354,463 | 4.8 | 7 | –3 |
| Communist Party of the Netherlands | 330,398 | 4.5 | 7 | +1 |
| Democrats 1966 | 307,048 | 4.2 | 6 | –5 |
| Democratic Socialists '70 | 304,714 | 4.1 | 6 | –2 |
| Reformed Political Party | 163,114 | 2.2 | 3 | 0 |
| Farmers' Party | 143,239 | 1.9 | 3 | +2 |
| Reformed Political League | 131,236 | 1.8 | 2 | 0 |
| Pacifist Socialist Party | 111,262 | 1.5 | 2 | 0 |
| Roman Catholic Party of the Netherlands | 67,658 | 0.9 | 1 | New |
| Anti Woningnood Actie Centrum | 77,245 | 1.0 | 0 | New |
| Democratic Centre Party | 0 | New | ||
| Stam List | 0 | New | ||
| New Middle Party | 0 | –2 | ||
| New Roman Party | 0 | 0 | ||
| Party of the Right | 0 | 0 | ||
| Invalid/blank votes | 51,242 | – | – | – |
| Total | 7,445,287 | 100 | 150 | 0 |
| Registered voters/turnout | 8,916,947 | 83.5 | – | – |
| Source: Nohlen & Stöver | ||||
References
| General elections |
|
|---|---|
| Provincial elections | |
| Municipal elections | |
| European elections | |
| Referendums | |
| |
This article is issued from
Wikipedia.
The text is licensed under Creative Commons - Attribution - Sharealike.
Additional terms may apply for the media files.