Doncaster Central (UK Parliament constituency)
Coordinates: 53°30′40″N 1°07′19″W / 53.511°N 1.122°W
| Doncaster Central | |
|---|---|
|
Borough constituency for the House of Commons | |
|
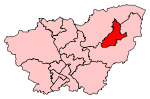
Boundary of Doncaster Central in South Yorkshire for the 2010 general election. | |
|
Location of South Yorkshire within England. | |
| County | South Yorkshire |
| Electorate | 73,874 (December 2010)[1] |
| Major settlements | Doncaster |
| Current constituency | |
| Created | 1983 |
| Member of parliament | Rosie Winterton (Labour) |
| Number of members | One |
| Created from | Doncaster and Don Valley[2] |
| Overlaps | |
| European Parliament constituency | Yorkshire and the Humber |

Doncaster Central is a constituency[n 1] represented in the House of Commons of the UK Parliament since 1997 by Rosie Winterton of the Labour Party.[n 2] Since 2017 Winterton has served as Second Deputy Chairman of Ways and Means, one of three Deputy Speakers of the House; she is the second MP for the constituency to be a Deputy Speaker, after Harold Walker.
History and profile
Created in 1983, the seat covers most of the large Yorkshire town of Doncaster served by an international airport and the UK motorway network in the former Doncaster constituency and since its 1983 inception has been a Labour stronghold.
Boundaries
1983-2010: The Metropolitan Borough of Doncaster wards of Armthorpe, Balby, Bessacarr, Central, Intake, Town Field, and Wheatley.
2010–present: The Metropolitan Borough of Doncaster wards of Armthorpe, Balby, Bessacarr and Cantley, Central, Edenthorpe, Kirk Sandall and Barnby Dun, Town Moor, and Wheatley.
The constituency includes most of the town of Doncaster and neighbours the Doncaster North and Don Valley seats.
Members of Parliament
| Election | Member[3] | Party | Notes | |
|---|---|---|---|---|
| 1983 | Sir Harold Walker | Labour | Previously MP for Doncaster 1964-1983. Chairman of Ways and Means 1983-1992, knighted 1992 | |
| 1997 | Rosie Winterton | Labour | Labour Chief Whip 2010-2016; Second Deputy Chairman of Ways and Means 2017-present | |
Elections
Elections in the 2010s
]]| Party | Candidate | Votes | % | ± | |
|---|---|---|---|---|---|
| Labour | Rosie Winterton | 24,915 | 57.9 | +8.8 | |
| Conservative | Tom Hunt | 14,784 | 34.4 | +13.6 | |
| Yorkshire Party | Chris Whitwood | 1,346 | 3.1 | N/A | |
| Independent | Eddie Todd | 1,006 | 2.3 | N/A | |
| Liberal Democrat | Alison Brelsford | 973 | 2.3 | -2.0 | |
| Majority | 10,131 | 23.5 | -1.5 | ||
| Turnout | 43,024 | 60.0 | +3.2 | ||
| Labour hold | Swing | -2.4 | |||
| Party | Candidate | Votes | % | ± | |
|---|---|---|---|---|---|
| Labour | Rosie Winterton | 19,840 | 49.1 | +9.4 | |
| UKIP | Chris Hodgson | 9,747 | 24.1 | +20.7 | |
| Conservative | Zoe Metcalfe | 8,386 | 20.7 | −4.0 | |
| Liberal Democrat | John Brown | 1,717 | 4.2 | −16.8 | |
| TUSC | Mev Akram | 421 | 1.0 | +1.0 | |
| English Democrat | David Burnett | 309 | 0.8 | −3.6 | |
| Majority | 10,093 | 25.0 | +10.1 | ||
| Turnout | 40,420 | 56.8 | +1.3 | ||
| Labour hold | Swing | ||||
| Party | Candidate | Votes | % | ± | |
|---|---|---|---|---|---|
| Labour | Rosie Winterton | 16,569 | 39.7 | −11.3 | |
| Conservative | Gareth M. Davies | 10,340 | 24.8 | +6.1 | |
| Liberal Democrat | Patrick Wilson | 8,795 | 21.1 | −2.6 | |
| English Democrat | Lawrence E. Parramore | 1,816 | 4.4 | N/A | |
| BNP | John Bettney | 1,762 | 4.2 | +0.9 | |
| UKIP | John Andrews | 1,421 | 3.4 | 0 | |
| Independent | Scott A. Pickles | 970 | 2.3 | N/A | |
| Citizens for Undead Rights and Equality | Derek A. Williams | 72 | 0.2 | N/A | |
| Majority | 6,229 | 14.9 | −13.6 | ||
| Turnout | 41,745 | 55.5 | +3.5 | ||
| Labour hold | Swing | −8.7 | |||
Elections in the 2000s
| Party | Candidate | Votes | % | ± | |
|---|---|---|---|---|---|
| Labour | Rosie Winterton | 17,617 | 51.3 | −7.8 | |
| Liberal Democrat | Patrick Wilson | 7,815 | 22.8 | +9.9 | |
| Conservative | Stefan Kerner | 6,489 | 18.9 | −4.8 | |
| BNP | John Wilkinson | 1,239 | 3.6 | +3.6 | |
| UKIP | Alan Simmons | 1,191 | 3.5 | +0.8 | |
| Majority | 9,802 | 28.5 | |||
| Turnout | 34,351 | 52.3 | 0.7 | ||
| Labour hold | Swing | −8.8 | |||
| Party | Candidate | Votes | % | ± | |
|---|---|---|---|---|---|
| Labour | Rosie Winterton | 20,034 | 59.1 | −3.0 | |
| Conservative | Gary Meggitt | 8,035 | 23.7 | +2.7 | |
| Liberal Democrat | Michael Southcombe | 4,390 | 12.9 | +3.5 | |
| UKIP | David Gordon | 926 | 2.7 | +1.7 | |
| Socialist Alliance | Janet Terry | 517 | 1.5 | N/A | |
| Majority | 11,999 | 35.4 | |||
| Turnout | 33,902 | 51.6 | −12.3 | ||
| Labour hold | Swing | ||||
Elections in the 1990s
| Party | Candidate | Votes | % | ± | |
|---|---|---|---|---|---|
| Labour | Rosie Winterton | 26,961 | 62.1 | +7.8 | |
| Conservative | David Turtle | 9,105 | 21.0 | −12.5 | |
| Liberal Democrat | Simon Tarry | 4,091 | 9.4 | −2.4 | |
| Referendum | Michael Cliff | 1,273 | 2.9 | N/A | |
| Socialist Labour | Michael Kenny | 854 | 2.0 | N/A | |
| ProLife Alliance | Jonathan Redden | 694 | 1.6 | N/A | |
| UKIP | Peter Davies | 462 | 1.1 | N/A | |
| Majority | 17,856 | 38.7 | |||
| Turnout | 43,440 | 63.9 | |||
| Labour hold | Swing | ||||
| Party | Candidate | Votes | % | ± | |
|---|---|---|---|---|---|
| Labour | Harold Walker | 27,795 | 54.3 | +3.2 | |
| Conservative | George Glossop | 17,113 | 33.5 | −1.7 | |
| Liberal Democrat | Clifford Hampson | 6,057 | 11.8 | −1.8 | |
| Workers Revolutionary | Michael Driver | 184 | 0.4 | N/A | |
| Majority | 10,682 | 20.9 | +4.9 | ||
| Turnout | 51,149 | 74.2 | +0.6 | ||
| Labour hold | Swing | +2.5 | |||
Elections in the 1980s
| Party | Candidate | Votes | % | ± | |
|---|---|---|---|---|---|
| Labour | Harold Walker | 26,266 | 51.2 | +9.2 | |
| Conservative | Patricia Rawlings | 18,070 | 35.2 | −1.9 | |
| Social Democratic | James Gore-Browne | 7,004 | 13.6 | −7.3 | |
| Majority | 8,196 | 16.0 | |||
| Turnout | 51,340 | 73.7 | |||
| Labour hold | Swing | +5.6 | |||
| Party | Candidate | Votes | % | ± | |
|---|---|---|---|---|---|
| Labour | Harold Walker | 21,154 | 42.0 | N/A | |
| Conservative | John Somers | 18,646 | 37.1 | N/A | |
| Social Democratic | Trevor Stables | 10,524 | 20.9 | N/A | |
| Majority | 2,508 | 5.0 | N/A | ||
| Turnout | 50,324 | 70.8 | N/A | ||
| Labour win (new seat) | |||||
See also
Notes and references
- Notes
- ↑ A borough constituency (for the purposes of election expenses and type of returning officer)
- ↑ As with all constituencies, the constituency elects one Member of Parliament (MP) by the first past the post system of election at least every five years.
- References
- ↑ "Electorate Figures - Boundary Commission for England". 2011 Electorate Figures. Boundary Commission for England. 4 March 2011. Archived from the original on 6 November 2010. Retrieved 13 March 2011.
- ↑ "'Doncaster Central', June 1983 up to May 1997". ElectionWeb Project. Cognitive Computing Limited. Retrieved 10 March 2016.
- ↑ Leigh Rayment's Historical List of MPs – Constituencies beginning with "D" (part 2)
- ↑ http://www.bbc.co.uk/news/politics/constituencies/E14000668
- ↑ "Doncaster Central". BBC News. Retrieved 14 May 2015.
- ↑ "Election Data 2015". Electoral Calculus. Archived from the original on 17 October 2015. Retrieved 17 October 2015.
- ↑ "Doncaster Central". BBC News: Election 2010. BBC. 2010-05-06. Retrieved 2010-05-08.
- ↑ "Election Data 2010". Electoral Calculus. Archived from the original on 26 July 2013. Retrieved 17 October 2015.
- ↑ "Election Data 2005". Electoral Calculus. Archived from the original on 15 October 2011. Retrieved 18 October 2015.
- ↑ "Election Data 2001". Electoral Calculus. Archived from the original on 15 October 2011. Retrieved 18 October 2015.
- ↑ "Election Data 1997". Electoral Calculus. Archived from the original on 15 October 2011. Retrieved 18 October 2015.
- ↑ "Politics Resources". Election 1992. Politics Resources. 9 April 1992. Retrieved 2010-12-06.
- ↑ "Election Data 1992". Electoral Calculus. Archived from the original on 15 October 2011. Retrieved 18 October 2015.
- ↑ "Election Data 1987". Electoral Calculus. Archived from the original on 15 October 2011. Retrieved 18 October 2015.
- ↑ "Election Data 1983". Electoral Calculus. Archived from the original on 15 October 2011. Retrieved 18 October 2015.
Sources
- Guardian Unlimited Politics (Election results from 1992 to the present)
- http://www.psr.keele.ac.uk/ (Election results from 1951 to the present)