Comparison of imports vs exports of the United States
The Following is a comparative list of the balance of trade for imports vs exports of the United States in 2015 ($Billions of Dollars).[1][2]

| Product | Imports | Exports | Difference +/- |
|---|---|---|---|
| Electronic equipment | $332.9 | $169.8 | -$163.1 |
| Machines, engines, pumps | $329.3 | $205.8 | -$123.5 |
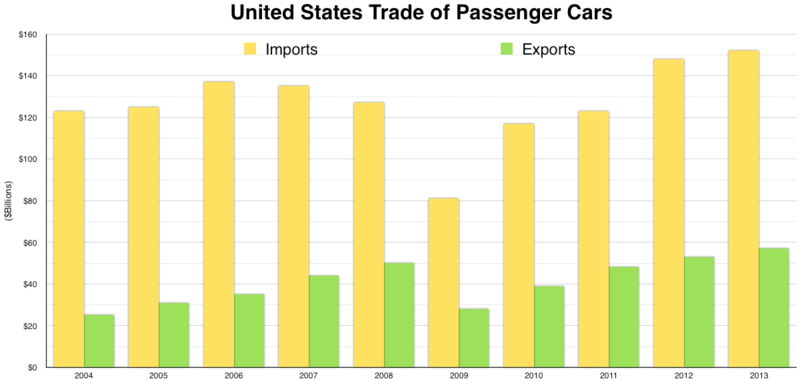
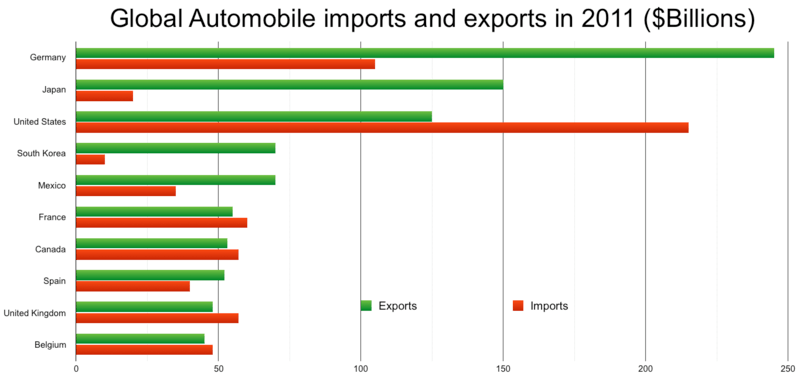
| Vehicles | $283.8 | $127.1 | -$146.7 |
| Fuel | $201.2 | $106.1 | -$95.1 |
| Pharmaceuticals | $86.1 | $47.3 | -$38.8 |
| Medical, technical equipment | $78.3 | $83.4 | +$5.1 |
| Furniture, lighting, signs | $61.2 | $11.5 | -$49.7 |
| Gems, precious metals | $60.2 | $58.7 | -$1.5 |
| Organic chemicals | $52.1 | $38.8 | -$13.3 |
| Plastics | $50.2 | $60.3 | +$10.1 |
| Aircraft/Spacecraft | $35.3 | $131.1 | +$95.8 |
| Total of all trade | $2.309 Trillion | $1.51 Trillion | -$799 |
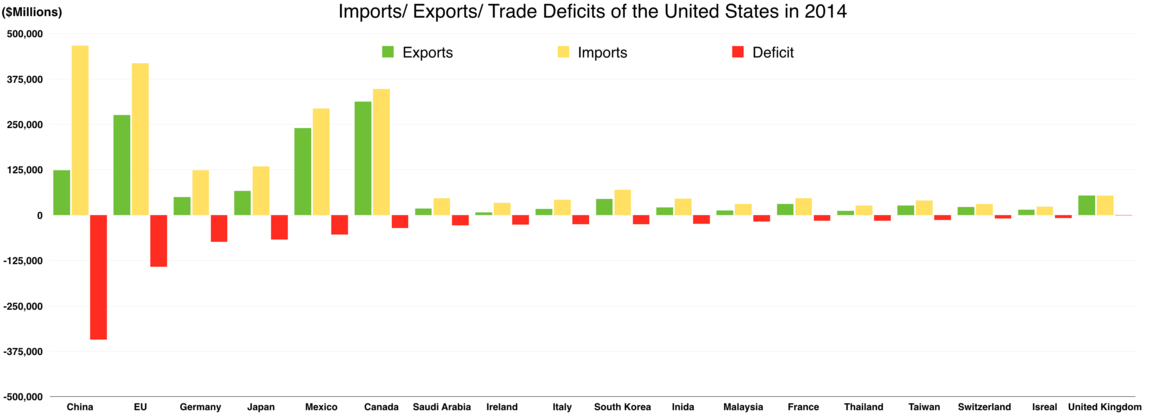
| Balance of Trade 2014[3] | |||||||||
|---|---|---|---|---|---|---|---|---|---|
| China | Euro Area | Japan | Mexico | Pacific | Canada | Middle East | Lat. America | Total by Product | |
| Computer | -151.9 | 3.4 | -8.0 | -11.0 | -26.1 | 20.9 | 5.8 | 12.1 | -155.0 |
| Oil, Gas, Minerals | 1.9 | 6.4 | 2.4 | -20.8 | 1.1 | -79.8 | -45.1 | -15.9 | -149.7 |
| Transportation | 10.9 | -30.9 | -46.2 | -59.5 | -0.5 | -6.1 | 17.1 | 8.8 | -106.3 |
| Apparel | -56.3 | -4.9 | 0.6 | -4.2 | -6.3 | 2.5 | -0.3 | -1.1 | -69.9 |
| Electrical Equipment | -35.9 | -2.4 | -4.0 | -8.5 | -3.3 | 10.0 | 1.8 | 2.0 | -40.4 |
| Misc. Manufacturing | -35.3 | 4.9 | 2.7 | -2.8 | -1.4 | 5.8 | -1.5 | 1.8 | -25.8 |
| Furniture | -18.3 | -1.2 | 0.0 | -1.6 | -2.1 | 0.4 | 0.2 | 0.0 | -22.6 |
| Machinery | -19.9 | -27.0 | -18.8 | 3.9 | 7.6 | 18.1 | 4.5 | 9.1 | -22.4 |
| Primary Metals | -3.1 | 3.1 | -1.8 | 1.0 | 1.9 | -8.9 | -0.9 | -10.4 | -19.1 |
| Fabricated Metals | -17.9 | -5.9 | -3.5 | 2.8 | -4.3 | 7.3 | 1.2 | 1.9 | -18.5 |
| Plastics | -15.7 | -1.9 | -2.0 | 5.7 | -4.1 | 2.6 | -0.1 | 0.5 | -15.0 |
| Textile | -12.3 | -1.1 | -0.3 | 2.8 | -4.6 | 1.5 | -0.9 | 0.2 | -14.7 |
| Beverages, Tobacco | 1.3 | -9.9 | 0.6 | -3.3 | 0.0 | 1.0 | 0.2 | -0.6 | -10.6 |
| Nonmetallic Minerals | -6.1 | -1.9 | -0.4 | -1.2 | 0.1 | 1.9 | -0.5 | -0.8 | -8.9 |
| Paper | -2.7 | 1.2 | 1.1 | 4.3 | 1.2 | -9.8 | 0.9 | -1.9 | -5.8 |
| Chemical | -3.9 | -39.5 | -1.5 | 19.1 | 3.2 | 4.6 | -2.4 | 15.8 | -4.7 |
| Food | 0.7 | -3.6 | 6.1 | 4.9 | 0.9 | 0.1 | 1.4 | -1.1 | 9.5 |
| Agriculture | 17.8 | 6.2 | 7.3 | -3.0 | 5.7 | -0.8 | 2.8 | -6.5 | 29.5 |
| Petroleum | 0.6 | -1.2 | 0.1 | 16.6 | -2.0 | -0.1 | 0.6 | 18.3 | 32.9 |
| Total by Country/Area | -346.1 | -106.1 | -65.6 | -54.9 | -33.0 | -29.0 | -15.1 | 32.3 | |
| Country | Exports | Imports | Trade Deficit |
|---|---|---|---|
| |
123,676 | 446,754 | 343,078 |
| |
276,142 | 418,754 | 142,059 |
| |
49,363 | 123,260 | 73,897 |
| |
66,827 | 134,004 | 67,117 |
| |
240,249 | 294,074 | 53,825 |
| |
312,421 | 347,798 | 35,377 |
| |
18,705 | 47,041 | 28,336 |
| |
7,806 | 33,956 | 26,150 |
| |
16,968 | 42,115 | 25,147 |
| |
44,471 | 69,518 | 25,047 |
| |
21,608 | 45,244 | 23,636 |
| |
13,068 | 30,420 | 17,352 |
| |
31,301 | 46,874 | 15,573 |
| |
11,810 | 27,123 | 15,313 |
| |
26,670 | 40,581 | 13,911 |
| |
22,176 | 31,191 | 9,015 |
| |
15,083 | 22,962 | 7,879 |
| |
53,823 | 54,392 | 569 |
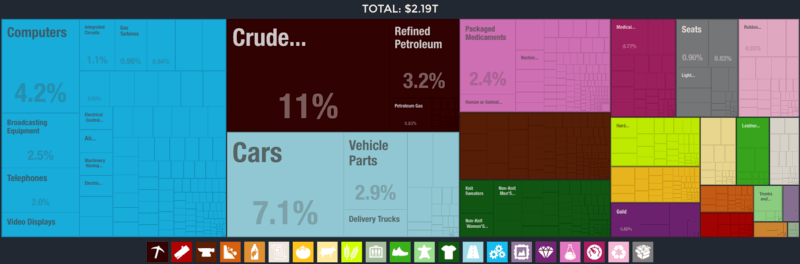
United States imports 2014. atlas.media.mit.edu

United States exports 2014. atlas.media.mit.edu

Imports vs exports & net imports
See also
- List of exports of the United States
- List of the largest trading partners of the United States
- Value added tax trade criticism
- Balance of trade in the United States
References
- ↑ "Top US Exports".
- ↑ "United States Top 10 Imports". 4 November 2016.
- ↑ http://www.businessinsider.com/balance-of-goods-us-trading-partners-from-goldman-sachs-2017-5
- ↑ http://www.census.gov/foreign-trade/statistics/highlights/top/top1112yr.html
- ↑ Top U.S. Trade Partners Ranked by 2014 U.S. Total Export Value for Goods (in millions of U.S. dollars)
This article is issued from
Wikipedia.
The text is licensed under Creative Commons - Attribution - Sharealike.
Additional terms may apply for the media files.