List of cities in South Dakota

Map of the United States with South Dakota highlighted
This is a list of places incorporated in the state of South Dakota as cities. Municipalities in South Dakota can also be incorporated as towns. South Dakota also has one incorporated village, Wentworth.[1]

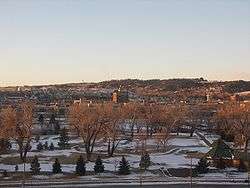
Sioux Falls, largest city in South Dakota
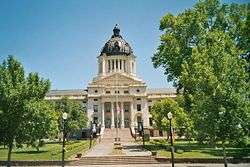
Pierre, capital of South Dakota
Cities in South Dakota, with their populations (as of July 1, 2016, per the United States Census Bureau):
| 2016 Rank | City | 2016 Estimate[2] | 2010 Census[3] | Change | County |
|---|---|---|---|---|---|
| 1 | Sioux Falls † | 174,360 | 153,888 | +13.30% | Minnehaha Lincoln[4] |
| 2 | Rapid City † | 74,048 | 67,956 | +8.96% | Pennington |
| 3 | Aberdeen † | 28,415 | 26,091 | +8.91% | Brown |
| 4 | Brookings † | 23,895 | 22,056 | +8.34% | Brookings |
| 5 | Watertown † | 22,172 | 21,482 | +3.21% | Codington |
| 6 | Mitchell † | 15,729 | 15,254 | +3.11% | Davison |
| 7 | Yankton † | 14,566 | 14,454 | +0.77% | Yankton |
| 8 | Pierre †† | 14,008 | 13,646 | +2.65% | Hughes |
| 9 | Huron † | 13,117 | 12,592 | +4.17% | Beadle |
| 10 | Spearfish | 11,531 | 10,494 | +9.88% | Lawrence |
| 11 | Vermillion † | 10,844 | 10,571 | +2.58% | Clay |
| 12 | Brandon | 9,923 | 8,785 | +12.95% | Minnehaha |
| 13 | Box Elder | 9,348 | 7,800 | +19.85% | Pennington Meade |
| 14 | Madison † | 7,425 | 6,474 | +14.69% | Lake |
| 15 | Sturgis † | 6,832 | 6,627 | +3.09% | Meade |
| 16 | Harrisburg | 5,734 | 4,089 | +40.23% | Lincoln |
| 17 | Belle Fourche † | 5,655 | 5,594 | +1.09% | Butte |
| 18 | Tea | 5,032 | 3,806 | +32.21% | Lincoln |
| 19 | Dell Rapids | 3,705 | 3,633 | +1.98% | Minnehaha |
| 20 | Mobridge | 3,570 | 3,465 | +3.03% | Walworth |
| 21 | Hot Springs † | 3,564 | 3,711 | −3.96% | Fall River[5] |
| 22 | Canton † | 3,386 | 3,057 | +10.76% | Lincoln |
| 23 | Milbank † | 3,203 | 3,353 | −4.47% | Grant |
| 24 | Hartford | 3,140 | 2,534 | +23.91% | Minnehaha |
| 25 | Lead | 3,010 | 3,124 | −3.65% | Lawrence |
| 26 | Winner † | 2,861 | 2,897 | −1.24% | Tripp[6] |
| 27 | North Sioux City | 2,731 | 2,530 | +7.94% | Union |
| 28 | Sisseton † | 2,429 | 2,470 | −1.66% | Roberts |
| 29 | Summerset | 2,392 | 1,814 | +31.86% | Meade |
| 30 | Chamberlain † | 2,369 | 2,387 | −0.75% | Brule |
| 31 | Redfield † | 2,339 | 2,333 | +0.26% | Spink |
| 32 | Flandreau † | 2,332 | 2,341 | −0.38% | Moody |
| 33 | Lennox | 2,330 | 2,111 | +10.37% | Lincoln |
| 34 | Fort Pierre † | 2,148 | 2,078 | +3.37% | Stanley |
| 35 | Beresford | 1,969 | 2,005 | −1.80% | Union Lincoln |
| 36 | Custer † | 1,956 | 2,067 | −5.37% | Custer |
| 37 | Springfield | 1,950 | 1,989 | −1.96% | Bon Homme |
| 38 | Volga | 1,910 | 1,768 | +8.03% | Brookings |
| 39 | Elk Point † | 1,851 | 1,963 | −5.71% | Union |
| 40 | Webster † | 1,808 | 1,886 | −4.14% | Day |
| 41 | Wagner | 1,586 | 1,566 | +1.28% | Charles Mix |
| 42 | Parkston | 1,511 | 1,508 | +0.20% | Hutchinson |
| 43 | Groton | 1,509 | 1,458 | +3.50% | Brown |
| 44 | Miller † | 1,420 | 1,489 | −4.63% | Hand |
| 45 | Eagle Butte | 1,349 | 1,318 | +2.35% | Dewey Ziebach |
| 46 | Crooks | 1,327 | 1,269 | +4.57% | Minnehaha |
| 47 | Salem † | 1,324 | 1,347 | −1.71% | McCook |
| 48 | Freeman | 1,308 | 1,306 | +0.15% | Hutchinson |
| 49 | Platte | 1,273 | 1,230 | +3.50% | Charles Mix |
| 50 | Deadwood † | 1,264 | 1,270 | −0.47% | Lawrence |
| 51 | Britton † | 1,250 | 1,241 | +0.73% | Marshall |
| 52 | Gregory | 1,244 | 1,295 | −3.94% | Gregory |
| 53 | Mission | 1,236 | 1,183 | +4.48% | Todd |
| 54 | Clear Lake † | 1,226 | 1,273 | −3.69% | Deuel |
| 55 | Lemmon | 1,216 | 1,227 | −0.90% | Perkins |
| 56 | Garretson | 1,193 | 1,166 | +2.32% | Minnehaha |
| 57 | Gettysburg † | 1,155 | 1,162 | −0.60% | Potter |
| 58 | Baltic | 1,152 | 1,089 | +5.79% | Minnehaha |
| 59 | De Smet † | 1,077 | 1,089 | −1.10% | Kingsbury |
| 60 | Martin † | 1,071 | 1,071 | 0.00% | Bennett |
| 61 | Tyndall † | 1,049 | 1,067 | −1.69% | Bon Homme |
| 62 | Clark † | 1,048 | 1,139 | −7.99% | Clark |
| 63 | Hill City | 1,008 | 948 | +6.33% | Pennington |
| 64 | Parker † | 1,007 | 1,022 | −1.47% | Turner |
| 65 | Worthing | 957 | 877 | +9.12% | Lincoln |
| 66 | Ipswich † | 951 | 954 | −0.31% | Edmunds |
| 67 | Whitewood | 931 | 927 | +0.43% | Lawrence |
| 68 | Wessington Springs † | 921 | 956 | −3.66% | Jerauld |
| 69 | Arlington | 880 | 915 | −3.83% | Kingsbury Brookings |
| 70 | Centerville | 879 | 882 | −0.34% | Turner |
| 71 | Wall | 872 | 766 | +13.84% | Pennington |
| 72 | Piedmont | 860 | 222 | +287.39% | Meade |
| 73 | Eureka | 848 | 868 | −2.30% | McPherson |
| 74 | Lake Andes † | 841 | 879 | −4.32% | Charles Mix |
| 75 | Scotland | 819 | 841 | −2.62% | Bon Homme |
| 76 | Howard † | 800 | 858 | −6.76% | Miner |
| 77 | Marion | 779 | 784 | −0.64% | Turner |
| 78 | Viborg | 774 | 782 | −1.02% | Turner |
| 79 | Philip † | 765 | 779 | −1.80% | Haakon |
| 80 | Valley Springs | 760 | 759 | +0.13% | Minnehaha |
| 81 | Highmore † | 754 | 795 | −5.16% | Hyde |
| 82 | Estelline | 751 | 768 | −2.21% | Hamlin |
| 83 | Alcester | 748 | 807 | −7.31% | Union |
| 84 | Faulkton † | 747 | 736 | +1.49% | Faulk |
| 85 | Edgemont | 736 | 774 | −4.91% | Fall River |
| 86 | Elkton | 723 | 736 | −1.77% | Brookings |
| 87 | Plankinton † | 718 | 707 | +1.56% | Aurora |
| 88 | Kadoka † | 707 | 654 | +8.10% | Jackson |
| 89 | Colton | 684 | 687 | −0.44% | Minnehaha |
| 90 | Kimball | 679 | 703 | −3.41% | Brule |
| 91 | Armour † | 678 | 699 | −3.00% | Douglas |
| 92 | Woonsocket † | 671 | 655 | +2.44% | Sanborn |
| 93 | New Underwood | 668 | 660 | +1.21% | Pennington |
| 94 | Aurora | 667 | 532 | +25.38% | Brookings |
| 95 | McLaughlin | 665 | 663 | +0.30% | Corson |
| 96 | Onida † | 659 | 658 | +0.15% | Sully |
| 97 | Selby † | 649 | 642 | +1.09% | Walworth |
| 98 | Tripp | 638 | 647 | −1.39% | Hutchinson |
| 99 | Canistota | 636 | 656 | −3.05% | McCook |
| 100 | Castlewood | 633 | 627 | +0.96% | Hamlin |
| 101 | Alexandria † | 626 | 615 | +1.79% | Hanson |
| 102 | Menno | 620 | 608 | +1.97% | Hutchinson |
| 103 | Avon | 591 | 590 | +0.17% | Bon Homme |
| 104 | White River † | 587 | 581 | +1.03% | Mellette |
| 105-(T) | Burke † | 586 | 604 | −2.98% | Gregory |
| 105-(T) | Newell | 586 | 603 | −2.82% | Butte |
| 107 | Corsica | 584 | 592 | −1.35% | Douglas |
| 108 | Humboldt | 580 | 589 | −1.53% | Minnehaha |
| 109 | Colman | 579 | 594 | −2.53% | Moody |
| 110 | St. Francis | 576 | 709 | −18.76% | Todd |
| 111 | Waubay | 575 | 576 | −0.17% | Day |
| 112 | Lake Preston | 565 | 599 | −5.68% | Kingsbury |
| 113 | Veblen | 539 | 531 | +1.51% | Marshall |
| 114 | Dupree † | 527 | 525 | +0.38% | Ziebach |
| 115-(T) | Jefferson | 507 | 547 | −7.31% | Union |
| 115-(T) | Presho | 507 | 497 | +2.01% | Lyman |
| 117 | Wilmot | 499 | 492 | +1.42% | Roberts |
| 118 | Bowdle | 492 | 502 | −1.99% | Edmunds |
| 119 | Timber Lake † | 489 | 443 | +10.38% | Dewey |
| 120 | Warner | 488 | 457 | +6.78% | Brown |
| 121 | White | 487 | 485 | +0.41% | Brookings |
| 122 | Lake Norden | 481 | 467 | +3.00% | Hamlin |
| 123 | Oacoma | 476 | 451 | +5.54% | Lyman |
| 124 | Bridgewater | 475 | 492 | −3.46% | McCook |
| 125 | Montrose | 463 | 463 | 0.00% | McCook |
| 126 | Murdo † | 461 | 488 | −5.53% | Jones |
| 127 | Big Stone City | 456 | 467 | −2.36% | Grant |
| 128 | Bryant | 450 | 456 | −1.32% | Hamlin |
| 129 | Emery | 449 | 447 | +0.45% | Hanson |
| 130-(T) | Leola † | 441 | 457 | −3.50% | McPherson |
| 130-(T) | Mount Vernon | 441 | 462 | −4.55% | Davison |
| 132 | Rosholt | 423 | 423 | 0.00% | Roberts |
| 133 | Irene | 421 | 420 | +0.24% | Clay Turner Yankton |
| 134 | Faith | 419 | 421 | −0.48% | Meade |
| 135 | Herreid | 416 | 438 | −5.02% | Campbell |
| 136 | Tabor | 413 | 423 | −2.36% | Bon Homme |
| 137 | Gayville | 409 | 407 | +0.49% | Yankton |
| 138 | Hurley | 405 | 415 | −2.41% | Turner |
| 139 | Hoven | 399 | 406 | −1.72% | Potter |
| 140 | Wolsey | 394 | 376 | +4.79% | Beadle |
| 141 | Hermosa | 392 | 398 | −1.51% | Custer |
| 142 | Hayti † | 378 | 381 | −0.79% | Hamlin |
| 143 | White Lake | 372 | 372 | 0.00% | Aurora |
| 144 | Florence | 369 | 374 | −1.34% | Codington |
| 145 | Blunt | 358 | 354 | +1.13% | Hughes |
| 146 | Buffalo † | 353 | 330 | +6.97% | Harding |
| 147 | Keystone | 340 | 337 | +0.89% | Pennington |
| 148 | Bison † | 336 | 333 | +0.90% | Perkins |
| 149 | Ethan | 329 | 331 | −0.60% | Davison |
| 150 | Bristol | 328 | 341 | −3.81% | Day |
| 151 | Langford | 326 | 313 | +4.15% | Marshall |
| 152 | Hudson | 320 | 296 | +8.11% | Lincoln |
| 153 | Wakonda | 316 | 321 | −1.56% | Clay |
| 154 | Roscoe | 313 | 329 | −4.86% | Edmunds |
| 155 | Pukwana | 296 | 285 | +3.86% | Brule |
| 156 | Summit | 288 | 288 | 0.00% | Roberts |
| 157-(T) | Colome | 286 | 296 | −3.38% | Tripp |
| 157-(T) | Stickney | 286 | 284 | +0.70% | Aurora |
| 159 | Alpena | 278 | 286 | −2.80% | Jerauld |
| 160 | Egan | 276 | 278 | −0.72% | Moody |
| 161 | Bonesteel | 272 | 275 | −1.09% | Gregory |
| 162 | Henry | 264 | 267 | −1.12% | Codington |
| 163 | Chancellor | 262 | 264 | −0.76% | Turner |
| 164-(T) | Iroquois | 261 | 266 | −1.88% | Kingsbury Beadle |
| 164-(T) | Kennebec † | 261 | 240 | +8.75% | Lyman |
| 166 | New Effington | 256 | 256 | 0.00% | Roberts |
| 167 | Willow Lake | 245 | 263 | −6.84% | Clark |
| 168 | Nisland | 236 | 232 | +1.72% | Butte |
| 169 | Trent | 235 | 232 | +1.29% | Moody |
| 170 | Hecla | 229 | 227 | +0.88% | Brown |
| 171 | Delmont | 228 | 234 | −2.56% | Douglas |
| 172-(T) | Pollock | 226 | 241 | −6.22% | Campbell |
| 172-(T) | South Shore | 226 | 225 | +0.44% | Codington |
| 174 | Gary | 225 | 227 | −0.88% | Deuel |
| 175 | Pickstown | 224 | 201 | +11.44% | Charles Mix |
| 176 | Reliance | 219 | 191 | +14.66% | Lyman |
| 177 | Mellette | 218 | 210 | +3.81% | Spink |
| 178-(T) | Geddes | 214 | 208 | +2.88% | Charles Mix |
| 178-(T) | Tulare | 214 | 207 | +3.38% | Spink |
| 180 | Bruce | 206 | 204 | +0.98% | Brookings |
| 181-(T) | Ramona | 205 | 174 | +17.82% | Lake |
| 181-(T) | Toronto | 205 | 212 | −3.30% | Deuel |
| 183 | Frederick | 204 | 199 | +2.51% | Brown |
| 184 | Hosmer | 200 | 208 | −3.85% | Edmunds |
| 185 | St. Lawrence | 198 | 198 | 0.00% | Hand |
| 186 | Wentworth | 197 | 171 | +15.20% | Lake |
| 187 | Doland | 185 | 180 | +2.78% | Spink |
| 188 | Roslyn | 178 | 183 | −2.73% | Day |
| 189-(T) | Kranzburg | 177 | 172 | +2.91% | Codington |
| 189-(T) | Wessington | 177 | 170 | +4.12% | Beadle Hand |
| 191 | Letcher | 176 | 173 | +1.73% | Sanborn |
| 192 | Mission Hill | 173 | 177 | −2.26% | Yankton |
| 193 | McIntosh † | 172 | 173 | −0.58% | Corson |
| 194 | Peever | 168 | 168 | 0.00% | Roberts |
| 195 | Volin | 162 | 161 | +0.62% | Yankton |
| 196 | Monroe | 158 | 160 | −1.25% | Turner |
| 197 | Frankfort | 154 | 149 | +3.36% | Spink |
| 198 | Isabel | 152 | 135 | +12.59% | Dewey |
| 199 | Spencer | 151 | 154 | −1.95% | McCook |
| 200 | Northville | 146 | 143 | +2.10% | Spink |
| 201 | Conde | 145 | 140 | +3.57% | Spink |
| 202 | Goodwin | 141 | 146 | −3.42% | Deuel |
| 203 | Artesian | 140 | 138 | +1.45% | Sanborn |
| 204 | Carthage | 139 | 144 | −3.47% | Miner |
| 205 | Columbia | 137 | 136 | +0.74% | Brown |
| 206 | Buffalo Gap | 136 | 126 | +7.94% | Custer |
| 207 | Astoria | 135 | 139 | −2.88% | Deuel |
| 208-(T) | Java | 134 | 129 | +3.88% | Walworth |
| 208-(T) | Westport | 134 | 133 | +0.75% | Brown |
| 210-(T) | Central City | 131 | 134 | −2.24% | Lawrence |
| 210-(T) | Dimock | 131 | 125 | +4.80% | Hutchinson |
| 212 | Pierpont | 129 | 135 | −4.44% | Day |
| 213-(T) | Claremont | 128 | 127 | +0.79% | Brown |
| 213-(T) | Lesterville | 128 | 127 | +0.79% | Yankton |
| 215-(T) | Oelrichs | 127 | 126 | +0.79% | Fall River |
| 215-(T) | Oldham | 127 | 133 | −4.51% | Kingsbury |
| 217 | Midland | 126 | 129 | −2.33% | Haakon |
| 218 | Ashton | 124 | 122 | +1.64% | Spink |
| 219 | Harrold | 123 | 124 | −0.81% | Hughes |
| 220 | Dallas | 122 | 120 | +1.67% | Gregory |
| 221 | Sinai | 119 | 120 | −0.83% | Brookings |
| 222 | Cavour | 118 | 114 | +3.51% | Beadle |
| 223 | Batesland | 115 | 108 | +6.48% | Oglala Lakota |
| 224 | Revillo | 114 | 119 | −4.20% | Grant |
| 225 | Fairfax | 112 | 115 | −2.61% | Gregory |
| 226 | Yale | 111 | 108 | +2.78% | Beadle |
| 227-(T) | Corona | 109 | 109 | 0.00% | Roberts |
| 227-(T) | Pringle | 109 | 112 | −2.68% | Custer |
| 229 | Glenham | 108 | 105 | +2.86% | Walworth |
| 230 | Stockholm | 107 | 108 | −0.93% | Grant |
| 231-(T) | Brandt | 104 | 107 | −2.80% | Deuel |
| 231-(T) | Interior | 104 | 94 | +10.64% | Jackson |
| 233-(T) | Badger | 103 | 107 | −3.74% | Kingsbury |
| 233-(T) | Canova | 103 | 105 | −1.90% | Miner |
| 233-(T) | Cresbard | 103 | 104 | −0.96% | Faulk |
| 236 | Herrick | 102 | 105 | −2.86% | Gregory |
| 237 | Eden | 96 | 89 | +7.87% | Marshall |
| 238 | Hitchcock | 94 | 91 | +3.30% | Beadle |
| 239 | Fulton | 92 | 91 | +1.10% | Hanson |
| 240 | Fairburn | 91 | 85 | +7.06% | Custer |
| 241 | Hazel | 90 | 91 | −1.10% | Hamlin |
| 242-(T) | Andover | 87 | 91 | −4.40% | Day |
| 242-(T) | Davis | 87 | 85 | +2.35% | Turner |
| 244 | Dante | 86 | 84 | +2.38% | Charles Mix |
| 245 | Wallace | 84 | 85 | −1.18% | Codington |
| 246 | Wasta | 82 | 80 | +2.50% | Pennington |
| 247-(T) | Agar | 81 | 76 | +6.58% | Sully |
| 247-(T) | Sherman | 81 | 78 | +3.85% | Minnehaha |
| 249 | Claire City | 78 | 76 | +2.63% | Roberts |
| 250 | New Witten | 77 | 79 | −2.53% | Tripp |
| 251 | Brentford | 76 | 77 | −1.30% | Spink |
| 252 | Draper | 75 | 82 | −8.54% | Jones |
| 253 | Olivet † | 74 | 74 | 0.00% | Hutchinson |
| 254-(T) | Bradley | 73 | 72 | +1.39% | Clark |
| 254-(T) | Stratford | 73 | 72 | +1.39% | Brown |
| 256 | Strandburg | 71 | 72 | −1.39% | Grant |
| 257 | Morristown | 69 | 67 | +2.99% | Corson |
| 258-(T) | La Bolt | 67 | 68 | −1.47% | Grant |
| 258-(T) | Mound City † | 67 | 71 | −5.63% | Campbell |
| 260-(T) | Camp Crook | 66 | 63 | +4.76% | Harding |
| 260-(T) | Twin Brooks | 66 | 69 | −4.35% | Grant |
| 262-(T) | Bushnell | 65 | 65 | 0.00% | Brookings |
| 262-(T) | Ortley | 65 | 65 | 0.00% | Roberts |
| 264-(T) | Fairview | 64 | 60 | +6.67% | Lincoln |
| 264-(T) | Utica | 64 | 65 | −1.54% | Yankton |
| 264-(T) | Wood | 64 | 62 | +3.23% | Mellette |
| 267-(T) | Fruitdale | 63 | 64 | −1.56% | Butte |
| 267-(T) | Ravinia | 63 | 61 | +3.28% | Charles Mix |
| 269 | Orient | 62 | 63 | −1.59% | Faulk |
| 270 | Ree Heights | 60 | 62 | −3.23% | Hand |
| 271-(T) | Lane | 57 | 59 | −3.39% | Jerauld |
| 271-(T) | Quinn | 57 | 54 | +5.56% | Pennington |
| 273 | Garden City | 55 | 53 | +3.77% | Clark |
| 274 | Belvidere | 54 | 49 | +10.20% | Jackson |
| 275 | Grenville | 53 | 54 | −1.85% | Day |
| 276-(T) | Lake City | 52 | 51 | +1.96% | Marshall |
| 276-(T) | Raymond | 52 | 50 | +4.00% | Clark |
| 278 | Ward | 50 | 48 | +4.17% | Moody |
| 279 | Nunda | 49 | 43 | +13.95% | Lake |
| 280 | Turton | 47 | 48 | −2.08% | Spink |
| 281-(T) | Lebanon | 46 | 47 | −2.13% | Potter |
| 281-(T) | Vienna | 46 | 45 | +2.22% | Clark |
| 283 | Akaska | 45 | 42 | +7.14% | Walworth |
| 284 | Hetland | 44 | 46 | −4.35% | Kingsbury |
| 285 | Erwin | 43 | 45 | −4.44% | Kingsbury |
| 286 | Naples | 38 | 41 | −7.32% | Clark |
| 287 | Seneca | 37 | 38 | −2.63% | Faulk |
| 288-(T) | Dolton | 36 | 37 | −2.70% | Turner |
| 288-(T) | Tolstoy | 36 | 36 | 0.00% | Potter |
| 290 | Altamont | 33 | 34 | −2.94% | Deuel |
| 291-(T) | Broadland | 32 | 31 | +3.23% | Beadle |
| 291-(T) | Marvin | 32 | 34 | −5.88% | Grant |
| 291-(T) | Rockham | 32 | 33 | −3.03% | Faulk |
| 294 | Long Lake | 31 | 31 | 0.00% | McPherson |
| 295 | Chelsea | 26 | 27 | −3.70% | Faulk |
| 296 | Vilas | 19 | 20 | −5.00% | Miner |
| 297 | Bancroft | 18 | 19 | −5.26% | Kingsbury |
| 298-(T) | Butler | 16 | 17 | −5.88% | Day |
| 298-(T) | Virgil | 16 | 16 | 0.00% | Beadle |
| 300-(T) | Albee | 15 | 16 | −6.25% | Grant |
| 300-(T) | Onaka | 15 | 15 | 0.00% | Faulk |
| 302-(T) | Cottonwood | 10 | 9 | +11.11% | Jackson |
| 302-(T) | Farmer | 10 | 10 | 0.00% | Hanson |
| 304-(T) | Artas | 8 | 9 | −11.11% | Campbell |
| 304-(T) | Wetonka | 8 | 8 | 0.00% | McPherson |
| 306 | Lowry | 6 | 6 | 0.00% | Walworth |
| 307 | Verdon | 5 | 5 | 0.00% | Brown |
| 308 | Lily | 4 | 4 | 0.00% | Day |
| 309-(T) | Hillsview | 3 | 3 | 0.00% | McPherson |
| 309-(T) | White Rock | 3 | 3 | 0.00% | Roberts |
See also
- List of towns in South Dakota
- List of townships in South Dakota
- List of census-designated places in South Dakota
References
- ↑ "US Board on Geographic Names". United States Geological Survey. 2007-10-25. Retrieved 2008-01-31.
- ↑ "Annual Estimates of the Resident Population: April 1, 2010 to July 1, 2016". United States Census Bureau. Retrieved 26 May 2017.
- ↑ "2010 Census Redistricting Data (Public Law 94-171) Summary File". American FactFinder2. U.S. Census Bureau, 2010 Census. Retrieved 29 October 2012.
- ↑ Sioux Falls is the county seat of Minnehaha County. Though its city limits extend into neighboring Lincoln County, Canton is the county seat for Lincoln County.
- ↑ Hot Springs is also the de facto county seat of neighboring Oglala Lakota County.
- ↑ Winner is also the de facto county seat of neighboring Todd County.
This article is issued from
Wikipedia.
The text is licensed under Creative Commons - Attribution - Sharealike.
Additional terms may apply for the media files.