Chelmsford (UK Parliament constituency)
| Chelmsford | |
|---|---|
|
Borough constituency for the House of Commons | |
|
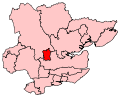
Boundary of Chelmsford in Essex. | |
|
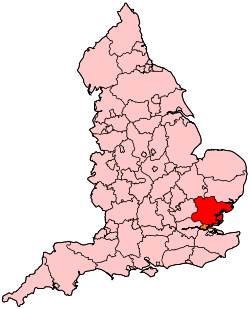
Location of Essex within England. | |
| County | Essex |
| Population | 105,424 (2011 census)[1] |
| Electorate | 77,835 (December 2010)[2] |
| Major settlements | Chelmsford, Great Baddow |
| Current constituency | |
| Created | 2010 |
| Member of parliament | Vicky Ford (Conservative) |
| Number of members | One |
| Created from | West Chelmsford, Maldon & East Chelmsford |
| 1885–1997 | |
| Replaced by | West Chelmsford, Maldon and Chelmsford East, Rayleigh |
| Created from | West Essex |
| Overlaps | |
| European Parliament constituency | East of England |
Chelmsford is a constituency[n 1] represented in the House of Commons of the UK Parliament since 2017 by Vicky Ford of the Conservative Party.
Boundaries
1885–1918: The Sessional Divisions of Brentwood (except the parishes of Rainham and Wennington) and Chelmsford.
1918–1950: The Borough of Chelmsford, the Urban District of Brentwood, the Rural Districts of Chelmsford and Ongar, and in the Rural District of Billericay the parishes of Hutton, Ingrave, Mountnessing, Shenfield, and South Weald.
1950–1955: The Borough of Chelmsford, and the Rural Districts of Chelmsford and Ongar.
1955–1974: The Borough of Chelmsford, and the Rural District of Chelmsford.
1974–1983: The Borough of Chelmsford, and in the Rural District of Chelmsford the parishes of Danbury, East Hanningfield, Great Baddow, Highwood, Ingatestone and Fryerning, Little Baddow, Margaretting, Mountnessing, Rettendon, Runwell, Sandon, South Hanningfield, Stock, West Hanningfield, and Woodham Ferrers.
1983–1997: The Borough of Chelmsford wards of All Saints, Baddow Road, Boreham and Springfield, Cathedral, Danbury and Sandon, East and West Hanningfield, Galleywood, Goat Hall, Great Baddow Village, Highwood and Margaretting, Little Baddow, Mildmays, Moulsham Lodge, Oaklands, Patching Hall, Rothmans, St Andrew's, Stock, The Lawns, and Waterhouse Farm.
2010–present: The Borough of Chelmsford wards of Chelmer Village and Beaulieu Park, Galleywood, Goat Hall, Great Baddow East, Great Baddow West, Marconi, Moulsham and Central, Moulsham Lodge, Patching Hall, St Andrew's, Springfield North, The Lawns, Trinity, and Waterhouse Farm.
Following the Boundary Commission review of parliamentary representation in 2008 Parliament created a new Chelmsford constituency which had for the previous three elections been split in two halves and included more surrounding rural settlements. A majority of the electorate for this new constituency comes from the previous West Chelmsford constituency. A smaller element (Great Baddow and outskirts) comes from the Maldon & East Chelmsford constituency.
The constituency is contained entirely within the Borough of Chelmsford which is larger and also contributes to the Maldon and Saffron Walden constituencies.
At its first contest in 2010, the seat was closely fought by the Conservatives and the Liberal Democrats, who finished less than 10% apart, with Conservative candidate Simon Burns (the former MP for West Chelmsford) being elected. Labour polled 11%, despite having been only around 100 votes behind the Liberal Democrats in West Chelmsford in 2005, and even taking second place in 2001.
History


Chelmsford had its own constituency from 1885 until its abolition in 1997. During its latter years, the old seat was narrowly won by a Conservative over a strong Liberal Democrat performances, including their predecessor party the Liberal Party. The constituency was recreated in time for the 2010 general election.
Members of Parliament
MPs 1885–1997
MPs since 2010
| Election | Member[4] | Party | |
|---|---|---|---|
| 2010 | Sir Simon Burns | Conservative | |
| 2017 | Vicky Ford | Conservative | |
Elections
Elections in the 2010s
| Party | Candidate | Votes | % | ± | |
|---|---|---|---|---|---|
| Conservative | Vicky Ford[6] | 30,525 | 53.7 | +2.2 | |
| Labour | Chris Vince[7] | 16,953 | 29.8 | +12.2 | |
| Liberal Democrat | Stephen Robinson | 6,916 | 12.2 | +0.3 | |
| UKIP | Nigel Carter | 1,645 | 2.9 | −11.3 | |
| Green | Reza Hossain | 821 | 1.4 | −2.1 | |
| Majority | 13,572 | 23.9 | −10.0 | ||
| Turnout | 56,860 | 70.2 | +3.7 | ||
| Conservative hold | Swing | −5.0 | |||
| Party | Candidate | Votes | % | ± | |
|---|---|---|---|---|---|
| Conservative | Simon Burns | 27,732 | 51.5 | +5.4 | |
| Labour | Chris Vince [10] | 9,482 | 17.6 | +6.7 | |
| UKIP | Mark Gough[11] | 7,652 | 14.2 | +11.4 | |
| Liberal Democrat | Stephen Robinson | 6,394 | 11.9 | −24.9 | |
| Green | Angela Thomson | 1,892 | 3.5 | +2.6 | |
| Liberal | Henry Boyle | 665 | 1.2 | +1.2 | |
| Majority | 18,250 | 33.9 | |||
| Turnout | 53,817 | 68.5 | |||
| Conservative hold | Swing | ||||
| Party | Candidate | Votes | % | ± | |
|---|---|---|---|---|---|
| Conservative | Simon Burns* | 25,207 | 46.2 | +6.7 | |
| Liberal Democrat | Stephen Robinson | 20,097 | 36.8 | +6.6 | |
| Labour | Peter Dixon | 5,980 | 11.0 | −16.0 | |
| UKIP | Ken Wedon | 1,527 | 2.8 | −0.6 | |
| BNP | Michael Bateman | 899 | 1.6 | +1.6 | |
| Green | Angela Thomson | 476 | 0.9 | +0.9 | |
| English Democrat | Claire Breed | 254 | 0.5 | +0.3 | |
| Reduce Tax On Beer | Ben Sherman | 153 | 0.3 | +0.3 | |
| Majority | 5,110 | 9.4 | |||
| Turnout | 54,593 | 70.4 | +9.3 | ||
| Conservative hold | Swing | ||||
- * Served in the 2005–2010 Parliament as MP for West Chelmsford
Elections in the 1990s
| Party | Candidate | Votes | % | ± | |
|---|---|---|---|---|---|
| Conservative | Simon Burns | 39,043 | 55.3 | +3.4 | |
| Liberal Democrat | Hugh Nicholson | 20,783 | 29.4 | −11.1 | |
| Labour | Roy Chad | 10,010 | 14.2 | +7.3 | |
| Green | Eleanor Burgess | 769 | 1.1 | +0.4 | |
| Majority | 18,260 | 25.9 | +14.4 | ||
| Turnout | 70,605 | 84.6 | +2.5 | ||
| Conservative hold | Swing | +7.2 | |||
Elections in the 1980s
| Party | Candidate | Votes | % | ± | |
|---|---|---|---|---|---|
| Conservative | Simon Burns | 35,231 | 51.9 | +4.3 | |
| Liberal | Stuart Mole | 27,470 | 40.5 | −6.5 | |
| Labour | Clive Playford | 4,642 | 6.8 | +1.7 | |
| Green | Anthony Slade | 486 | 0.7 | N/A | |
| Majority | 7,761 | 11.4 | +10.8 | ||
| Turnout | 67,829 | 82.2 | +2.8 | ||
| Conservative hold | Swing | +5.4 | |||
| Party | Candidate | Votes | % | ± | |
|---|---|---|---|---|---|
| Conservative | Norman St John-Stevas | 29,824 | 47.6 | −2.0 | |
| Liberal | Stuart Mole | 29,446 | 47.0 | +5.5 | |
| Labour | Clive Playford | 3,208 | 5.1 | −3.8 | |
| Independent | Philip Waite | 127 | 0.2 | N/A | |
| Majority | 378 | 0.6 | −9.3 | ||
| Turnout | 62,605 | 79.4 | −4.5 | ||
| Conservative hold | Swing | −4.7 | |||
Elections in the 1970s
| Party | Candidate | Votes | % | ± | |
|---|---|---|---|---|---|
| Conservative | Norman St John-Stevas | 33,808 | 49.6 | +8.0 | |
| Liberal | Stuart Mole | 28,337 | 41.5 | +6.3 | |
| Labour | Susan Ann Reeves | 6,041 | 8.9 | −14.3 | |
| Majority | 5,471 | 8.1 | +2.5 | ||
| Turnout | 68,186 | 81.0 | +1.8 | ||
| Conservative hold | Swing | +0.9 | |||
| Party | Candidate | Votes | % | ± | |
|---|---|---|---|---|---|
| Conservative | Norman St John-Stevas | 26,334 | 41.6 | −1.3 | |
| Liberal | Stuart Mole | 22,332 | 35.2 | +2.2 | |
| Labour | John Thomas Acklaw | 14,711 | 23.2 | −0.9 | |
| Majority | 4,002 | 6.4 | −3.5 | ||
| Turnout | 66,377 | 79.2 | −4.7 | ||
| Conservative hold | Swing | −1.8 | |||
| Party | Candidate | Votes | % | ± | |
|---|---|---|---|---|---|
| Conservative | Norman St John-Stevas | 28,560 | 42.9 | −11.1 | |
| Liberal | Stuart Mole | 21,929 | 33.0 | +24.3 | |
| Labour | Frances Morrell | 16,063 | 24.1 | −12.7 | |
| Majority | 6,631 | 9.9 | |||
| Turnout | 66,552 | 83.9 | |||
| Conservative hold | Swing | ||||
| Party | Candidate | Votes | % | ± | |
|---|---|---|---|---|---|
| Conservative | Norman St John-Stevas | 36,821 | 55.15 | ||
| Labour | Gavin Kennedy | 23,780 | 35.62 | ||
| Liberal | Jessie Hunt | 5,811 | 8.70 | ||
| Independent | Joseph D Steel | 350 | 0.52 | ||
| Majority | 13,041 | 19.53 | |||
| Turnout | 66,762 | 75.60 | |||
| Conservative hold | Swing | +5.3 | |||
Elections in the 1960s
| Party | Candidate | Votes | % | ± | |
|---|---|---|---|---|---|
| Conservative | Norman St John-Stevas | 28,600 | 47.16 | ||
| Labour | Colin George | 23,625 | 38.96 | ||
| Liberal | W Peter Longhurst | 8,419 | 13.88 | ||
| Majority | 4,975 | 8.20 | |||
| Turnout | 60,644 | 82.47 | |||
| Conservative hold | Swing | -2.00 | |||
| Party | Candidate | Votes | % | ± | |
|---|---|---|---|---|---|
| Conservative | Norman St John-Stevas | 27,849 | 47.95 | ||
| Labour | E Gordon Lawrence | 20,816 | 35.84 | ||
| Liberal | W Peter Longhurst | 9,414 | 16.21 | ||
| Majority | 7,033 | 12.11 | |||
| Turnout | 58,105 | 82.78 | |||
| Conservative hold | Swing | ||||
Elections in the 1950s
| Party | Candidate | Votes | % | ± | |
|---|---|---|---|---|---|
| Conservative | Hubert Ashton | 29,992 | 59.85 | ||
| Labour | Brian Ralph Clapham | 20,124 | 40.15 | ||
| Majority | 9,868 | 19.69 | |||
| Turnout | 50,116 | 81.32 | |||
| Conservative hold | Swing | ||||
| Party | Candidate | Votes | % | ± | |
|---|---|---|---|---|---|
| Conservative | Hubert Ashton | 25,450 | 55.63 | ||
| Labour | Bernard Floud | 20,301 | 44.37 | ||
| Majority | 5,149 | 11.25 | |||
| Turnout | 45,751 | 81.82 | |||
| Conservative hold | Swing | ||||
| Party | Candidate | Votes | % | ± | |
|---|---|---|---|---|---|
| Conservative | Hubert Ashton | 29,069 | 55.01 | ||
| Labour | James Haworth | 23,775 | 44.99 | ||
| Majority | 5,294 | 10.02 | |||
| Turnout | 83.31 | ||||
| Conservative hold | Swing | ||||
| Party | Candidate | Votes | % | ± | |
|---|---|---|---|---|---|
| Conservative | Hubert Ashton | 28,541 | 54.65 | ||
| Labour | Ernest Millington | 23,682 | 45.35 | ||
| Majority | 4,859 | 9.30 | |||
| Turnout | 84.33 | ||||
| Conservative gain from Labour | Swing | ||||
Elections in the 1940s
| Party | Candidate | Votes | % | ± | |
|---|---|---|---|---|---|
| Common Wealth | Ernest Millington | 27,309 | 46.7 | ||
| Conservative | Hubert Ashton | 25,229 | 43.2 | ||
| Liberal | Hilda Buckmaster | 5,909 | 10.1 | ||
| Majority | 2,080 | 3.6 | |||
| Turnout | 73.4 | ||||
| Common Wealth hold | Swing | ||||
| Party | Candidate | Votes | % | ± | |
|---|---|---|---|---|---|
| Common Wealth | Ernest Millington | 24,548 | 57.5 | ||
| Conservative | Brian Batsford | 18,117 | 42.5 | ||
| Majority | 6,431 | 15.0 | |||
| Turnout | 54.1 | ||||
| Common Wealth gain from Conservative | Swing | ||||
General Election 1939/40:
Another General Election was required to take place before the end of 1940. The political parties had been making preparations for an election to take place from 1939 and by the end of this year, the following candidates had been selected;
- Conservative: John Macnamara
- Labour: Dr Mary Day
Elections in the 1930s
| Party | Candidate | Votes | % | ± | |
|---|---|---|---|---|---|
| Conservative | John Macnamara | 28,314 | 70.8 | ||
| Labour | Fred Hughes | 11,690 | 29.2 | ||
| Majority | 16,624 | 41.6 | |||
| Turnout | 40,004 | 65.4 | |||
| Conservative hold | Swing | ||||
| Party | Candidate | Votes | % | ± | |
|---|---|---|---|---|---|
| Conservative | Vivian Henderson | 31,961 | 80.5 | ||
| Labour | Joseph Sparks | 7,755 | 19.5 | ||
| Majority | 24,206 | 60.9 | |||
| Turnout | 39,716 | 70.9 | |||
| Conservative hold | Swing | ||||
Elections in the 1920s
| Party | Candidate | Votes | % | ± | |
|---|---|---|---|---|---|
| Unionist | Charles Howard-Bury | 17,094 | 43.8 | -4.0 | |
| Liberal | Sydney Walter Robinson | 13,034 | 33.4 | +3.2 | |
| Labour | Nils Henry Moller | 8,910 | 22.8 | +0.8 | |
| Majority | 4,060 | 10.4 | -7.2 | ||
| Turnout | 39,038 | 75.1 | +4.6 | ||
| Unionist hold | Swing | -3.6 | |||
| Party | Candidate | Votes | % | ± | |
|---|---|---|---|---|---|
| Unionist | Charles Howard-Bury | 13,395 | 47.8 | -6.9 | |
| Liberal | Sydney Walter Robinson | 8,435 | 30.2 | -5.1 | |
| Labour | Nils Henry Moller | 6,140 | 22.0 | +12.0 | |
| Majority | 4,960 | 17.6 | -1.8 | ||
| Turnout | 70.5 | -6.6 | |||
| Unionist hold | Swing | -0.9 | |||
| Party | Candidate | Votes | % | ± | |
|---|---|---|---|---|---|
| Unionist | Henry Curtis-Bennett | 15,875 | 54.7 | +10.5 | |
| Liberal | Sydney Walter Robinson | 10,244 | 35.3 | -20.5 | |
| Labour | Nils Henry Moller | 2,904 | 10.0 | n/a | |
| Majority | 5,631 | 19.4 | 31.0 | ||
| Turnout | 77.1 | +13.6 | |||
| Unionist gain from Liberal | Swing | +15.5 | |||
| Party | Candidate | Votes | % | ± | |
|---|---|---|---|---|---|
| Liberal | Sydney Walter Robinson | 12,877 | 55.8 | +26.0 | |
| Unionist | E. G. Pretyman | 10,185 | 44.2 | -8.4 | |
| Majority | 2,692 | 11.6 | 34.4 | ||
| Turnout | 63.5 | +2.5 | |||
| Liberal gain from Unionist | Swing | +17.2 | |||
| Party | Candidate | Votes | % | ± | |
|---|---|---|---|---|---|
| Unionist | E. G. Pretyman | 11,267 | 52.6 | -14.3 | |
| Liberal | Sydney Walter Robinson | 6,380 | 29.8 | n/a | |
| Labour | Clara Rackham | 3,767 | 17.6 | -15.5 | |
| Majority | 4,887 | 22.8 | -11.0 | ||
| Turnout | 61.0 | +10.8 | |||
| Unionist hold | Swing | n/a | |||
Elections in the 1910s
| Party | Candidate | Votes | % | ± | |
|---|---|---|---|---|---|
| Unionist | 11,217 | 66.9 | |||
| Labour | William Frederick Toynbee | 5,551 | 33.1 | ||
| Majority | 5,666 | 33.8 | |||
| Turnout | 50.2 | ||||
| Unionist hold | Swing | ||||
- endorsed by Coalition Government
| Party | Candidate | Votes | % | ± | |
|---|---|---|---|---|---|
| Conservative | E. G. Pretyman | unopposed | n/a | n/a | |
| Conservative hold | Swing | n/a | |||
| Party | Candidate | Votes | % | ± | |
|---|---|---|---|---|---|
| Conservative | E. G. Pretyman | 6,816 | 61.5 | -1.7 | |
| Liberal | T.Cuthbertson | 4,271 | 38.5 | +1.7 | |
| Majority | 2,545 | 23.0 | -3.4 | ||
| Turnout | 83.3 | +5.6 | |||
| Conservative hold | Swing | -1.7 | |||
Elections in the 1900s
| Party | Candidate | Votes | % | ± | |
|---|---|---|---|---|---|
| Conservative | E. G. Pretyman | 6,152 | 63.2 | ||
| Liberal | Alexander Henry Dence | 3,587 | 36.8 | ||
| Majority | 2,565 | 26.4 | |||
| Turnout | 77.7 | ||||
| Conservative hold | Swing | ||||
| Party | Candidate | Votes | % | ± | |
|---|---|---|---|---|---|
| Conservative | Carne Rasch | 4,915 | 52.4 | -20.5 | |
| Liberal | Alexander Henry Dence | 4,461 | 47.6 | +20.5 | |
| Majority | 454 | 4.8 | |||
| Turnout | 79.7 | ||||
| Conservative hold | Swing | +20.5 | |||
Boundary changes
| Preceded by Constituency created |
UK Parliament constituency Chelmsford (West), Writtle 1885–1997 |
Succeeded by Chelmsford West |
| UK Parliament constituency Chelmsford (East), Great Baddow, Danbury 1885–1997 |
Succeeded by Maldon and Chelmsford East | |
| UK Parliament constituency Ingatestone 1885–1974 |
Succeeded by Brentwood and Ongar | |
| UK Parliament constituency Ongar 1885–1955 |
Succeeded by Chigwell | |
| UK Parliament constituency Brentwood 1885–1950 |
Succeeded by Romford |
See also
Notes and references
- Notes
- ↑ A borough constituency (for the purposes of election expenses and type of returning officer)
- References
Craig, F. W. S. (1983). British parliamentary election results 1918–1949 (3 ed.). Chichester: Parliamentary Research Services. ISBN 0-900178-06-X.
- ↑ "Chelmsford: Usual Resident Population, 2011". Neighbourhood Statistics. Office for National Statistics. Retrieved 21 February 2015.
- ↑ "Electorate Figures – Boundary Commission for England". 2011 Electorate Figures. Boundary Commission for England. 4 March 2011. Archived from the original on 6 November 2010. Retrieved 13 March 2011.
- ↑ "Chelmsford 1885–1997". Hansard 1803–2005. UK Parliament. Retrieved 2 February 2015.
- 1 2 Leigh Rayment's Historical List of MPs – Constituencies beginning with "C" (part 3)
- ↑ "=Chelmsford City Council". Retrieved 18 May 2017.,
- ↑ "MEP Vicky Ford to fight for Chelmsford seat in General election". ITV. 29 April 2017. Retrieved 8 May 2017.
- ↑ "General Election 2017 – Candidate List – (A – M)". labour.org.uk. Retrieved 8 May 2017.
- ↑ "Election Data 2015". Electoral Calculus. Archived from the original on 17 October 2015. Retrieved 17 October 2015.
- ↑ "Chelmsford parliamentary constituency - Election 2017" – via www.bbc.co.uk.
- ↑ "CHELMSFORD 2015". electionresults.blogspot.co.uk.
- ↑ "Mark Gough PPC page". UK Independence Party. Retrieved 17 January 2015.
- ↑ "Election Data 2010". Electoral Calculus. Archived from the original on 26 July 2013. Retrieved 17 October 2015.
- ↑ "Election Data 1992". Electoral Calculus. Archived from the original on 15 October 2011. Retrieved 18 October 2015.
- ↑ "UK General Election results April 1992". Richard Kimber's Political Science Resources. Politics Resources. 9 April 1992. Retrieved 6 December 2010.
- ↑ "Election Data 1987". Electoral Calculus. Archived from the original on 15 October 2011. Retrieved 18 October 2015.
- ↑ "Election Data 1983". Electoral Calculus. Archived from the original on 15 October 2011. Retrieved 18 October 2015.
- 1 2 3 4 British parliamentary election results 1885–1918
- Sources
- F. W. S. Craig, British Parliamentary Election Results 1974 – 1983
- The Times Guide to the House of Commons 1983, 1987 & 1992
External links
- nomis Constituency Profile for Chelmsford — presenting data from the ONS annual population survey and other official statistics.