Canarian regional election, 2003
Canarian regional election, 2003
|
|---|
|
|
All 60 seats in the Parliament of the Canaries
31 seats needed for a majority |
|---|
| Registered |
1,439,784  8.2% 8.2% |
|---|
| Turnout |
930,449 (64.6%)
1.9 pp |
|---|
| |
First party |
Second party |
Third party |
| |
 |
.jpg) |
|
| Leader |
Adán Martín |
José Manuel Soria |
Juan Carlos Alemán |
| Party |
CC |
PP |
PSOE |
| Leader since |
2003 |
16 July 1999 |
2000 |
| Last election |
26 seats, 37.3% |
15 seats, 27.1% |
19 seats, 24.0% |
| Seats won |
23 |
17 |
17 |
| Seat change |
 3 3 |
2 |
2 |
| Popular vote |
304,413 |
283,186 |
235,234 |
| Percentage |
32.9% |
30.6% |
25.4% |
| Swing |
4.4 pp |
3.5 pp |
1.4 pp |
|
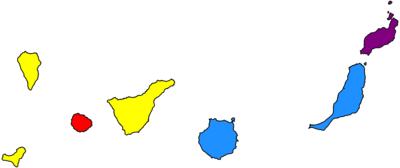
Island-level units won by CC (yellow), PP (blue), PSOE (red) and FNC (purple) |
|
The 2003 Canarian regional election was held on Sunday, 25 May 2003, to elect the 6th Parliament of the Autonomous Community of the Canary Islands. All 60 seats in the Parliament were up for election. The election was held simultaneously with regional elections in 12 other autonomous communities and local elections all throughout Spain.
Electoral system
The 60 members of the Canarian Parliament were elected in 7 multi-member districts using the D'Hondt method and a closed-list proportional representation system. Unlike other regions, districts did not coincide with provincial limits, being determined by law for each of the main islands to become a district of its own. The electoral system came regulated under the Autonomous Statute of Autonomy. Each district was assigned a fixed set of seats, distributed as follows: El Hierro (3), Fuerteventura (7), Gran Canaria (15), La Gomera (4), La Palma (8), Lanzarote (8) and Tenerife (15).
Voting was on the basis of universal suffrage in a secret ballot. Only lists polling above 30% of the total vote in each district or above 6% in all of the community (which include blank ballots—for none of the above) were entitled to enter the seat distribution.[1]
Results
Overall
|
Blank ballots |
11,806 | 1.28 | –0.23 |
|
|
| Total |
925,248 | 100.00 | |
60 | ±0 |
|
| Valid votes |
925,248 | 99.44 | +0.02 |
|
| Invalid votes |
5,201 | 0.56 | –0.02 |
| Votes cast / turnout |
930,449 | 64.62 | +1.88 |
| Abstentions |
509,335 | 35.38 | –1.88 |
| Registered voters |
1,439,784 | |
|
| Source(s): Argos Information Portal, ISTAC, historiaelectoral.com |
|
|
| Popular vote |
|---|
|
|
|
|
|
| CC |
|
32.90% |
| PP |
|
30.61% |
| PSOE |
|
25.42% |
| FNC |
|
4.83% |
| LV |
|
1.98% |
| IUC |
|
1.31% |
| Others |
|
1.67% |
| Blank ballots |
|
1.28% |
References