Canarian regional election, 2011
Canarian regional election, 2011
|
|---|
|
|
All 60 seats in the Parliament of the Canaries
31 seats needed for a majority |
|---|
| Registered |
1,580,359  2.8% 2.8% |
|---|
| Turnout |
931,010 (58.9%)
 2.3 pp 2.3 pp |
|---|
| |
First party |
Second party |
Third party |
| |
.jpg) |
 |
 |
| Leader |
José Manuel Soria |
Paulino Rivero |
José Miguel Pérez García |
| Party |
PP |
CC–PNC–CCN |
PSOE |
| Leader since |
16 July 1999 |
3 February 2007 |
20 March 2010 |
| Last election |
15 seats, 24.0% |
19 seats, 29.2% |
26 seats, 34.5% |
| Seats won |
21 |
21 |
15 |
| Seat change |
6 |
2 |
11 |
| Popular vote |
289,381 |
225,948 |
190,028 |
| Percentage |
31.9% |
24.9% |
21.0% |
| Swing |
7.9 pp |
4.3 pp |
13.5 pp |
|
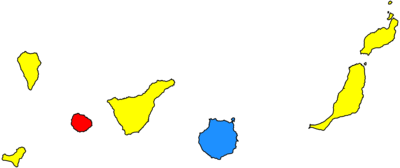
Island-level units won by PP (blue), CC (yellow) and PSOE (red) |
|
The 2011 Canarian regional election was held on Sunday, 22 May 2011, to elect the 8th Parliament of the Autonomous Community of the Canary Islands. All 60 seats in the Parliament were up for election. The election was held simultaneously with regional elections in 12 other autonomous communities and local elections all throughout Spain.
Electoral system
The 60 members of the Canarian Parliament were elected in 7 multi-member districts using the D'Hondt method and a closed-list proportional representation system. Unlike other regions, districts did not coincide with provincial limits, being determined by law for each of the main islands to become a district of its own. The electoral system came regulated under the Autonomous Statute of Autonomy. Each district was assigned a fixed set of seats, distributed as follows: El Hierro (3), Fuerteventura (7), Gran Canaria (15), La Gomera (4), La Palma (8), Lanzarote (8) and Tenerife (15).
Voting was on the basis of universal suffrage in a secret ballot. Only lists polling above 30% of the total vote in each district or above 6% in all of the community (which include blank ballots—for none of the above) were entitled to enter the seat distribution.[1]
Opinion polls
Vote
Poll results are listed in the table below in reverse chronological order, showing the most recent first. The highest percentage figure in each polling survey is displayed in bold, and the background shaded in the leading party's colour. In the instance that there is a tie, then no figure is shaded. The lead column on the right shows the percentage-point difference between the two parties with the highest figures. Poll results use the date the survey's fieldwork was done, as opposed to the date of publication. However, if such date is unknown, the date of publication will be given instead.
Seat projections
Opinion polls showing seat projections are displayed in the table below. The highest seat figures in each polling survey have their background shaded in the leading party's colour. In the instance that there is a tie, then no figure is shaded. 31 seats were required for an absolute majority in the Parliament of Canarias.
31 seats needed for majority
| Date |
Polling Firm/Source |
 |
 |
_Logo_(2008-2015).svg.png) |
 |
Others |
|
|
|
|
| 22 May 2011 |
Regional Election |
15 |
21 |
21 |
3 |
0 |
| Exit polls |
| 2–12 May |
Demométrica |
16−19 |
17−19 |
16−19 |
6 |
0 |
| 10 May |
TNS-Demoscopia |
19−21 |
18−20 |
18−20 |
0−3 |
0 |
| 13–20 Apr |
Celeste-Tel |
16 |
20 |
21 |
2 |
1 |
| 5–17 Apr |
OPMC |
20−21 |
16−18 |
19−21 |
3 |
0 |
| 17 Mar–17 Apr |
CIS |
23 |
19−20 |
16−17 |
0−2 |
0 |
| 22 Feb–17 Mar |
Demométrica |
17−19 |
16−19 |
17−19 |
6 |
0 |
| 15–18 Feb |
Sigma-2 |
16−21 |
19−20 |
20−24 |
0 |
0 |
| 1–9 Feb |
Perfiles |
17 |
22−24 |
18−20 |
1−3 |
0 |
| 2011 |
| 21–27 Dec |
Sigma-2 |
17−18 |
18−22 |
21−24 |
0 |
0 |
| 12–24 Jul |
OPMC |
23 |
15 |
20 |
2 |
0 |
| 19–24 May |
Sigma-2 |
20−23 |
14−17 |
22−24 |
0 |
0 |
| 2010 |
| 2009 |
| 2008 |
| 27 May 2007 |
Regional Election |
26 |
19 |
15 |
0 |
0 |
Results
Overall
| Parties with less than 1.0% of the vote |
46,517 |
5.13 |
— |
0 |
±0 |
|
Commitment for Gran Canaria (CGCa) |
7,382 | 0.81 | –0.10 |
0 | ±0 |
|
Canarian United Left (IUC) |
6,818 | 0.75 | +0.05 |
0 | ±0 |
|
Canarian Nationalist Alternative (ANC) |
6,494 | 0.72 | +0.45 |
0 | ±0 |
|
Common Sense in the Canaries (SCC) |
4,761 | 0.53 | New |
0 | ±0 |
|
Majorera Progressive Party (PPMAJO) |
4,334 | 0.48 | New |
0 | ±0 |
|
Canarian Patriotic Movement (MPC) |
2,750 | 0.30 | New |
0 | ±0 |
|
Anti-Bullfighting Party Against Mistreatment of Animals (PACMA) |
2,715 | 0.30 | New |
0 | ±0 |
|
Communist Party of the Canarian People (PCPC) |
2,368 | 0.26 | +0.12 |
0 | ±0 |
|
Party for Services and Public Employed (PSyEP) |
1,993 | 0.22 | New |
0 | ±0 |
|
For a Fairer World (PUM+J) |
1,442 | 0.16 | New |
0 | ±0 |
|
Movement for the Unity of the Canarian People (MUPC) |
1,268 | 0.14 | +0.08 |
0 | ±0 |
|
Humanist Party (PH) |
1,246 | 0.14 | +0.06 |
0 | ±0 |
|
Unity of the People (UP) |
1,133 | 0.13 | –0.03 |
0 | ±0 |
|
Liberal Democratic Centre (CDL) |
1,018 | 0.11 | New |
0 | ±0 |
|
Canarian Social Democratic Centre (CSDC) |
361 | 0.04 | New |
0 | ±0 |
|
National Democracy (DN) |
314 | 0.03 | ±0.00 |
0 | ±0 |
|
Communist Unification of Spain (UCE) |
120 | 0.01 | New |
0 | ±0 |
|
Blank ballots |
25,017 | 2.76 | +1.34 |
|
|
| Total |
905,959 | 100.00 | |
60 | ±0 |
|
| Valid votes |
905,959 | 97.31 | –2.12 |
|
| Invalid votes |
25,051 | 2.69 | +2.12 |
| Votes cast / turnout |
931,010 | 58.91 | –2.30 |
| Abstentions |
649,349 | 41.09 | +2.30 |
| Registered voters |
1,580,359 | |
|
| Source(s): Argos Information Portal, ISTAC, historiaelectoral.com |
|
|
| Popular vote |
|---|
|
|
|
|
|
| PP |
|
31.94% |
| CC–PNC–CCN |
|
24.94% |
| PSOE |
|
20.98% |
| NC |
|
9.07% |
| ACSSP |
|
2.10% |
| LV |
|
2.08% |
| UPyD |
|
1.00% |
| Others |
|
5.13% |
| Blank ballots |
|
2.76% |
Notes
- ↑ This survey shows its poll results projected over candidacy votes (that is, votes going for political parties, excluding blank ballots). The vote percentage in the official election is calculated including blank ballots into the estimation. In order to obtain data comparable to both the official results as well as those of other surveys, a rule of three has been applied to the survey projections, with the results of the calculation being shown instead.
- ↑ This poll provides data ranges and/or approximations. In order to simplify, the average of these data is given.
References
