Bootstrap aggregating
| Machine learning and data mining |
|---|
 |
|
Machine learning venues |
|
Bootstrap aggregating, also called bagging, is a machine learning ensemble meta-algorithm designed to improve the stability and accuracy of machine learning algorithms used in statistical classification and regression. It also reduces variance and helps to avoid overfitting. Although it is usually applied to decision tree methods, it can be used with any type of method. Bagging is a special case of the model averaging approach.
History
Bagging (Bootstrap aggregating) was proposed by Leo Breiman in 1994 to improve the classification by combining classifications of randomly generated training sets. See Breiman, 1994. Technical Report No. 421.
Description of the technique
Given a standard training set of size n, bagging generates m new training sets , each of size n′, by sampling from D uniformly and with replacement. By sampling with replacement, some observations may be repeated in each . If n′=n, then for large n the set is expected to have the fraction (1 - 1/e) (≈63.2%) of the unique examples of D, the rest being duplicates.[1] This kind of sample is known as a bootstrap sample. The m models are fitted using the above m bootstrap samples and combined by averaging the output (for regression) or voting (for classification).
Bagging leads to "improvements for unstable procedures" (Breiman, 1996), which include, for example, artificial neural networks, classification and regression trees, and subset selection in linear regression (Breiman, 1994). An interesting application of bagging showing improvement in preimage learning is provided here.[2][3] On the other hand, it can mildly degrade the performance of stable methods such as K-nearest neighbors (Breiman, 1996).
Example: Ozone data
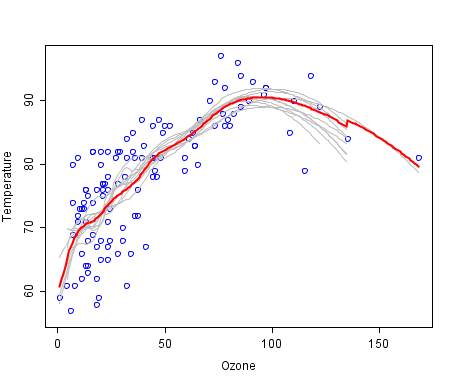
To illustrate the basic principles of bagging, below is an analysis on the relationship between ozone and temperature (data from Rousseeuw and Leroy (1986), analysis done in R).
The relationship between temperature and ozone in this data set is apparently non-linear, based on the scatter plot. To mathematically describe this relationship, LOESS smoothers (with span 0.5) are used. Instead of building a single smoother from the complete data set, 100 bootstrap samples of the data were drawn. Each sample is different from the original data set, yet resembles it in distribution and variability. For each bootstrap sample, a LOESS smoother was fit. Predictions from these 100 smoothers were then made across the range of the data. The first 10 predicted smooth fits appear as grey lines in the figure below. The lines are clearly very wiggly and they overfit the data - a result of the span being too low.
By taking the average of 100 smoothers, each fitted to a subset of the original data set, we arrive at one bagged predictor (red line). Clearly, the mean is more stable and there is less overfit.

See also
- Boosting (meta-algorithm)
- Bootstrapping (statistics)
- Cross-validation (statistics)
- Random forest
- Random subspace method (attribute bagging)
References
- ↑ Aslam, Javed A.; Popa, Raluca A.; and Rivest, Ronald L. (2007); On Estimating the Size and Confidence of a Statistical Audit, Proceedings of the Electronic Voting Technology Workshop (EVT '07), Boston, MA, August 6, 2007. More generally, when drawing with replacement n′ values out of a set of n (different and equally likely), the expected number of unique draws is .
- ↑ Sahu, A., Runger, G., Apley, D., Image denoising with a multi-phase kernel principal component approach and an ensemble version, IEEE Applied Imagery Pattern Recognition Workshop, pp.1-7, 2011.
- ↑ Shinde, Amit, Anshuman Sahu, Daniel Apley, and George Runger. "Preimages for Variation Patterns from Kernel PCA and Bagging." IIE Transactions, Vol.46, Iss.5, 2014
- Breiman, Leo (1996). "Bagging predictors". Machine Learning. 24 (2): 123–140. CiteSeerX 10.1.1.32.9399
 . doi:10.1007/BF00058655.
- Alfaro, E., Gámez, M. and García, N. (2012). "adabag: An R package for classification with AdaBoost.M1, AdaBoost-SAMME and Bagging".