Billericay (UK Parliament constituency)
| Billericay | |
|---|---|
|
Former County constituency for the House of Commons | |
|
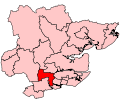
Boundary of Billericay in Essex in 2005. | |
|
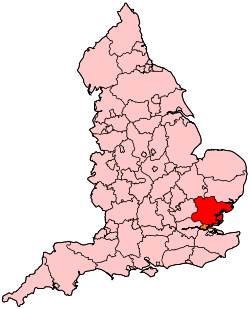
Location of Essex within England. | |
| County | Essex |
| 1983–2010 | |
| Number of members | One |
| Replaced by | Basildon and Billericay |
| Created from | Basildon and Thurrock[1] |
| 1950–February 1974 | |
| Replaced by | Basildon |
| Created from | South East Essex |
| European Parliament constituency | East of England |
Billericay was a constituency represented in the House of Commons of the Parliament of the United Kingdom. It elected one Member of Parliament (MP) by the first past the post system of election.
It returned Conservative MPs at every election except 1966.
Boundaries
1950-1955: The Urban Districts of Billericay, Benfleet, Canvey Island, and Rayleigh.
1955-1974: The Urban Districts of Billericay and Brentwood.
1983-1997: The District of Basildon wards of Billericay East, Billericay West, Burstead, Laindon, Wickford North, and Wickford South, and the Borough of Thurrock wards of Corringham and Fobbing, Orsett, Stanford-le-Hope, and The Homesteads.
1997-2010: The District of Basildon wards of Billericay East, Billericay West, Burstead, Laindon, Pitsea East, Pitsea West, Wickford North, and Wickford South.
For the 2010 general election, this seat was effectively merged with Basildon to form a new constituency of Basildon and Billericay.
History
Billericay has elected somewhat colourful characters to Westminster, namely Harvey Proctor, the right-wing MP who resigned after homosexual sex charges, and Teresa Gorman, the Maastricht rebel who stood down after accusing the Commons Standards and Privileges committee of sexism over questions surrounding her registered business dealings.
Members of Parliament
MPs 1950–1974
| Election | Member [2] | Party | |
|---|---|---|---|
| 1950 | Bernard Braine | Conservative | |
| 1955 | Richard Body | Conservative | |
| 1959 | Edward Gardner | Conservative | |
| 1966 | Eric Moonman | Labour | |
| 1970 | Robert McCrindle | Conservative | |
| Feb 1974 | constituency abolished: see Basildon | ||
MPs 1983–2010
| Election | Member [2] | Party | |
|---|---|---|---|
| 1983 | Harvey Proctor | Conservative | |
| 1987 | Teresa Gorman | Conservative | |
| 2001 | John Baron | Conservative | |
| 2010 | constituency abolished: see Basildon and Billericay | ||
Elections
Elections in the 1950s
| Party | Candidate | Votes | % | ± | |
|---|---|---|---|---|---|
| Conservative | Bernard Braine | 23,803 | 50.52 | ||
| Labour Co-op | Albert Oram | 19,437 | 41.26 | ||
| Liberal | Sidney Hayden | 3,872 | 8.22 | ||
| Majority | 4,366 | 9.27 | |||
| Turnout | 79.57 | ||||
| Conservative win (new seat) | |||||
| Party | Candidate | Votes | % | ± | |
|---|---|---|---|---|---|
| Conservative | Bernard Braine | 26,936 | 56.65 | ||
| Labour Co-op | Brian Ralph Clapham | 20,613 | 43.35 | ||
| Majority | 6,323 | 13.30 | |||
| Turnout | 77.12 | ||||
| Conservative hold | Swing | ||||
| Party | Candidate | Votes | % | ± | |
|---|---|---|---|---|---|
| Conservative | Richard Body | 24,327 | 54.73 | ||
| Labour Co-op | Brian Ralph Clapham | 20,121 | 45.27 | ||
| Majority | 4,206 | 9.46 | |||
| Turnout | 75.50 | ||||
| Conservative hold | Swing | ||||
| Party | Candidate | Votes | % | ± | |
|---|---|---|---|---|---|
| Conservative | Edward Gardner | 29,224 | 46.41 | ||
| Labour Co-op | Rita Alison Smythe | 24,402 | 38.75 | ||
| Liberal | Peter Myles Trelawney Sheldon-Williams | 9,347 | 14.84 | ||
| Majority | 4,822 | 7.66 | |||
| Turnout | 80.40 | ||||
| Conservative hold | Swing | ||||
Elections in the 1960s
| Party | Candidate | Votes | % | ± | |
|---|---|---|---|---|---|
| Conservative | Edward Gardner | 35,347 | 44.29 | ||
| Labour Co-op | Rita A. Smythe | 33,755 | 42.30 | ||
| Liberal | Peter MT Sheldon-Williams | 10,706 | 13.41 | ||
| Majority | 1,592 | 1.99 | |||
| Turnout | 82.48 | ||||
| Conservative hold | Swing | ||||
| Party | Candidate | Votes | % | ± | |
|---|---|---|---|---|---|
| Labour | Eric Moonman | 40,013 | 46.54 | ||
| Conservative | Edward Gardner | 38,371 | 44.63 | ||
| Liberal | Lionel Rufus Wernick | 7,587 | 8.83 | ||
| Majority | 1,642 | 1.91 | |||
| Turnout | 84.12 | ||||
| Labour gain from Conservative | Swing | ||||
Elections in the 1970s
| Party | Candidate | Votes | % | ± | |
|---|---|---|---|---|---|
| Conservative | Robert McCrindle | 47,719 | 52.2 | ||
| Labour | Eric Moonman | 43,765 | 47.8 | ||
| Majority | 3,954 | 4.3 | |||
| Turnout | 74.2 | ||||
| Conservative gain from Labour | Swing | ||||
Elections in the 1980s
| Party | Candidate | Votes | % | ± | |
|---|---|---|---|---|---|
| Conservative | Harvey Proctor | 29,635 | 53.7 | N/A | |
| Liberal | Patrick Bonner | 15,020 | 27.2 | N/A | |
| Labour | Christopher Sewell | 10,528 | 19.1 | N/A | |
| Majority | 14,615 | 26.5 | N/A | ||
| Turnout | 55,183 | 73.8 | N/A | ||
| Conservative win (new seat) | |||||
| Party | Candidate | Votes | % | ± | |
|---|---|---|---|---|---|
| Conservative | Teresa Gorman | 33,741 | 54.9 | +1.2 | |
| Social Democratic | Michael Birch | 15,755 | 25.6 | −1.6 | |
| Labour | Richard Howitt | 11,942 | 19.4 | +0.3 | |
| Majority | 17,986 | 29.3 | |||
| Turnout | 61,438 | 77.2 | |||
| Conservative hold | Swing | ||||
Elections in the 1990s
| Party | Candidate | Votes | % | ± | |
|---|---|---|---|---|---|
| Conservative | Teresa Gorman | 37,406 | 56.5 | +1.6 | |
| Liberal Democrat | Francis Bellard | 14,912 | 22.5 | −3.1 | |
| Labour | Alison Miller | 13,880 | 21.0 | +1.5 | |
| Majority | 22,494 | 34.0 | +4.6 | ||
| Turnout | 66,198 | 82.5 | +5.2 | ||
| Conservative hold | Swing | +2.3 | |||
| Party | Candidate | Votes | % | ± | |
|---|---|---|---|---|---|
| Conservative | Teresa Gorman | 22,033 | 39.8 | −17.9 | |
| Labour | Paul Richards | 20,677 | 37.3 | +17.2 | |
| Liberal Democrat | Geoff Williams | 8,763 | 15.8 | −6.5 | |
| Loyal Conservative | Brian Hughes | 3,377 | 6.1 | N/A | |
| ProLife Alliance | John Buchanan | 570 | 1.0 | N/A | |
| Majority | 1,356 | 2.4 | |||
| Turnout | 55,420 | 72.6 | |||
| Conservative hold | Swing | ||||
Elections in the 2000s
| Party | Candidate | Votes | % | ± | |
|---|---|---|---|---|---|
| Conservative | John Baron | 21,608 | 47.4 | +7.6 | |
| Labour | Amanda Campbell | 16,595 | 36.4 | −0.9 | |
| Liberal Democrat | Francis Bellard | 6,323 | 13.9 | −1.9 | |
| UKIP | Nicholas Yeomans | 1,072 | 2.4 | N/A | |
| Majority | 5,013 | 11.0 | |||
| Turnout | 45,598 | 58.1 | −14.6 | ||
| Conservative hold | Swing | ||||
| Party | Candidate | Votes | % | ± | |
|---|---|---|---|---|---|
| Conservative | John Baron | 25,487 | 52.2 | +4.8 | |
| Labour | Anneliese Dodds | 14,281 | 29.2 | −7.2 | |
| Liberal Democrat | Mike Hibbs | 6,471 | 13.2 | −0.7 | |
| BNP | Bryn Robinson | 1,435 | 2.9 | N/A | |
| UKIP | Seantino Callaghan | 1,184 | 2.4 | +0.0 | |
| Majority | 11,206 | 22.9 | |||
| Turnout | 48,858 | 61.4 | +3.3 | ||
| Conservative hold | Swing | 6.0 | |||
See also
Notes and references
- ↑ "'Billericay', June 1983 up to May 1997". ElectionWeb Project. Cognitive Computing Limited. Archived from the original on 11 March 2016. Retrieved 10 March 2016.
- 1 2 Leigh Rayment's Historical List of MPs – Constituencies beginning with "B" (part 3)
- ↑
- ↑
- ↑
- ↑
- ↑
- ↑ "Election Data 1983". Electoral Calculus. Archived from the original on 15 October 2011. Retrieved 18 October 2015.
- ↑ "Election Data 1987". Electoral Calculus. Archived from the original on 15 October 2011. Retrieved 18 October 2015.
- ↑ "Election Data 1992". Electoral Calculus. Archived from the original on 15 October 2011. Retrieved 18 October 2015.
- ↑ "Politics Resources". Election 1992. Politics Resources. 9 April 1992. Retrieved 6 Dec 2010.
- ↑ "Election Data 1997". Electoral Calculus. Archived from the original on 15 October 2011. Retrieved 18 October 2015.
- ↑ "Election Data 2001". Electoral Calculus. Archived from the original on 15 October 2011. Retrieved 18 October 2015.
- ↑ "Election Data 2005". Electoral Calculus. Archived from the original on 15 October 2011. Retrieved 18 October 2015.