Aisne's 3rd constituency
3rd constituency of the Aisne|
French National Assembly
constituency |
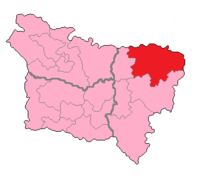
Aisne's 3rd Constituency shown within Picardie |
| Deputy |
|
|---|
| Department |
Aisne |
|---|
| Canton |
Aubenton, Bohain-en-Vermandois, La Capelle, Guise, Hirson, Marle, Le Nouvion-en-Thiérache, Ribemont, Sains-Richaumont, Vervins, Wassigny |
|---|
| Voters |
70,285 |
|---|
The 3rd constituency of the Aisne is a French legislative constituency in the Aisne département.
Description
Aisne's 3rd constituency covers the north east portion of the department.
The seat has been continuously controlled by the Socialist Party and its predecessor the SFIO since 1967.
Historic Representation
Election results
2007
[1]
Summary of the 10 June and 17 June 2007 French legislative in Aisne's 3rd Constituency election results
| Candidate |
Party |
1st round |
2nd round |
| Votes |
% |
Votes |
% |
|
Jean-Pierre Balligand |
Socialist Party |
PS |
18,046 |
41.16% |
24,383 |
53.31% |
|
Frédéric Meura |
Union for a Popular Movement |
UMP |
15,889 |
36.24% |
21,354 |
46.69% |
|
Nathalie Fauvergue |
National Front |
FN |
3,278 |
7.48% |
|
|
Ginette Devaux |
Communist |
COM |
1,573 |
3.59% |
|
|
Edwin Legris |
Democratic Movement |
MoDem |
1,499 |
3.42% |
|
|
Dimitri Severac |
Far Left |
EXG |
947 |
2.16% |
|
|
Valérie Delattre |
The Greens |
VEC |
616 |
1.41% |
|
|
Andrée Flamengt |
Hunting, Fishing, Nature, Traditions |
CPNT |
507 |
1.16% |
|
|
Marc Pailler |
Far Left |
EXG |
467 |
1.07% |
|
|
Véronique Ballot |
Movement for France |
MPF |
432 |
0.99% |
|
|
Raymonde Remy |
Far Right |
EXD |
234 |
0.53% |
|
|
Isabelle Maillet |
Ecologist |
ECO |
216 |
0.49% |
|
|
Monique Choain |
Divers |
DIV |
138 |
0.31% |
|
|
| Total |
43,842 |
100% |
45,737 |
100% |
|
| Registered voters |
72,227 |
|
72,224 |
|
| Blank/Void ballots |
898 |
2.01% |
1,255 |
2.67% |
| Turnout |
44,740 |
61.94% |
46,992 |
65.06% |
| Abstentions |
27,487 |
38.06% |
25,232 |
34.94% |
|
| Result |
PS HOLD |
2012
[2]
Summary of the 10 June and 17 June 2012 French legislative in Aisne's 3rd Constituency election results
| Candidate |
Party |
1st round |
2nd round |
| Votes |
% |
Votes |
% |
|
Jean-Louis Bricout |
Socialist Party |
PS |
16,683 |
41.10% |
21,751 |
54.31% |
|
Frédéric Meura |
Union for a Popular Movement |
UMP |
13,005 |
32.04% |
18,301 |
45.69% |
|
Bertrant Dutheil de la Rochere |
National Front |
FN |
6,617 |
16.30% |
|
|
Régis Lecoyer |
Left Front |
FG |
1,888 |
4.65% |
|
|
Pierre Chabot |
Far Right |
EXD |
619 |
1.53% |
|
|
France Savelli |
Radical Party |
PRV |
535 |
1.32% |
|
|
Jean-Pierre Vitu |
Far Left |
EXG |
377 |
0.93% |
|
|
Didier Colpin |
Miscellaneous Right |
DVD |
354 |
0.87% |
|
|
Jean-Claude Pagniez |
Miscellaneous Right |
DVD |
327 |
0.81% |
|
|
Joël Pichonnier |
Miscellaneous Left |
DVG |
185 |
0.46% |
|
|
| Total |
40,590 |
100% |
40,052 |
100% |
|
| Registered voters |
70,292 |
|
70,285 |
|
| Blank/Void ballots |
791 |
1.91% |
1,361 |
3.29% |
| Turnout |
41,381 |
58.87% |
41,413 |
58.92% |
| Abstentions |
28,911 |
41.13% |
28,872 |
41.08% |
|
| Result |
PS HOLD |
2017
Summary of the 11 June and 17 June 2017 French legislative in Aisne's 3rd Constituency election results
| Candidate |
Party |
1st round |
2nd round |
| Votes |
% |
Votes |
% |
|
Paul-Henry Hansen-Catta |
National Front |
FN |
8,113 |
25.51% |
11,487 |
39.55% |
|
Jean-Louis Bricout |
Socialist Party |
PS |
7,556 |
23.76% |
17,558 |
60.45% |
|
Alain Husillos-Crespo |
Democratic Movement |
MoDem |
5,755 |
18.10% |
|
|
Laurent Marlot |
The Republicans |
LR |
4,841 |
15.22% |
|
|
Alexandra Mortet |
La France insoumise |
FI |
2,352 |
7.40% |
|
|
Philippe Torre |
Debout la France |
DLF |
1,242 |
3.91% |
|
|
Christophe Parent |
Ecologist |
ECO |
767 |
2.41% |
|
|
Aurélien Gall |
Communist |
COM |
613 |
1.93% |
|
|
Laetitia Voisin |
Far Left |
EXG |
358 |
1.13% |
|
|
Clémence Théry-Hermain |
Divers |
DIV |
207 |
0.65% |
|
|
| Total |
31,804 |
100% |
29,045 |
100% |
|
| Registered voters |
68,099 |
|
68,085 |
|
| Blank ballots |
639 |
1.95% |
1,606 |
5.12% |
| Void ballots |
287 |
0.88% |
687 |
2.19% |
| Turnout |
32,730 |
48.06% |
31,338 |
46.03% |
| Abstentions |
35,369 |
51.94% |
36,747 |
53.97% |
|
| Result |
PS HOLD |
Sources
- ↑ https://www.interieur.gouv.fr/Elections/Les-resultats/Legislatives/elecresult__legislatives_2007/(path)/legislatives_2007/002/circons03.html
- ↑ https://www.interieur.gouv.fr/Elections/Les-resultats/Legislatives/elecresult__LG2012/(path)/LG2012/002/00203.html