2017–18 Australian region cyclone season
| 2017–18 Australian region cyclone season | |
|---|---|
| Seasonal boundaries | |
| First system formed | 8 August 2017 |
| Last system dissipated | Season ongoing |
| Strongest storm | |
| Name | Tropical Low |
| • Maximum winds |
35 km/h (25 mph) (10-minute sustained) |
| • Lowest pressure | 1005 hPa (mbar) |
| Seasonal statistics | |
| Tropical lows | 1 |
| Tropical cyclones | 0 |
| Severe tropical cyclones | 0 |
| Total fatalities | 0 |
| Total damage | None |
| Related articles | |
The 2017–18 Australian region cyclone season is the period of the year when most tropical cyclones form in the Southern Indian Ocean and Pacific Oceans between 90°E and 160°E. The season will officially run from 1 November 2017 to 30 April 2018; however, tropical cyclones can form at any time of the year, as demonstrated by the first tropical low of the season in early August. Any tropical system that forms between 1 July 2017 and 30 June 2018 will count towards the season total. During the season, tropical cyclones will be officially monitored by one of the five tropical cyclone warning centres (TCWCs) that operate in this region. Three of the five centres are operated by the Australian Bureau of Meteorology (BOM) in Perth, Darwin and Brisbane, while the other two are operated by the National Weather Service of Papua New Guinea in Port Moresby and the Indonesian Agency for Meteorology, Climatology and Geophysics in Jakarta. The Joint Typhoon Warning Center (JTWC) of the United States and other national meteorological services including Météo-France at Réunion will also monitor the basin during the season.
Seasonal summary

Systems
Tropical Low
| Tropical low (Australian scale) | |
 | |
| Duration | 8 August – 8 August (Exited basin) |
|---|---|
| Peak intensity | 35 km/h (25 mph) (10-min) 1005 hPa (mbar) |
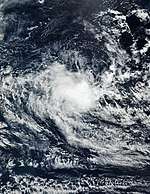
On 8 August, a low-pressure system that had been meandering in the Indian Ocean for a few days[1] was upgraded by the Bureau of Meteorology to a tropical low.[2] The system was located approximately 850 km (530 mi) to the west-northwest of the Cocos Islands, on the 90th meridian east—the western edge of the BOM's area of responsibility.[2][3] The tropical low moved in a west-southwesterly direction[2] and attained 35 km/h (25 mph) sustained winds south of the circulation centre (as assessed by Météo-France at Réunion),[4] and a minimum barometric pressure of 1005 hPa (29.68 inHg).[5] The storm moved out of the Australian region the same day.[5]
Storm names
Bureau of Meteorology
Since the start of the 2008–09 season, there has only been one list from which the Bureau of Meteorology has assigned tropical cyclone names despite the fact that three different warning centres are operated (in Perth, Darwin and Brisbane).[6] These warning centres monitor all tropical cyclones that form within the Australian region, as well as any in the areas of responsibility of either TCWC Jakarta or TCWC Port Moresby. The next 12 names on the naming list are shown below.
| Hilda (unused) | Irving (unused) | Joyce (unused) | Kelvin (unused) | Linda (unused) | Marcus (unused) |
| Nora (unused) | Owen (unused) | Penny (unused) | Riley (unused) | Savannah (unused) | Trevor (unused) |
TCWC Jakarta
TCWC Jakarta monitors Tropical Cyclones from the Equator to 11°S and from 90°E to 145°E. Should a tropical depression reach tropical cyclone strength within TCWC Jakarta's area of responsibility then it will be assigned the next name from the following list.[6]
| Cempaka (unused) | Dahlia (unused) | Flamboyan (unused) | Kenanga (unused) | Lili (unused) |
| Mangga (unused) | Seroja (unused) | Teratai (unused) | Anggrek (unused) | Bakung (unused) |
TCWC Port Moresby
Tropical cyclones that develop north of 11°S between 151°E and 160°E are assigned names by the TCWC Port Moresby. Tropical cyclone formation in this area is rare, with no cyclones being named in it since 2007.[7] As names are assigned in a random order, the whole list is shown below.
| Alu (unused) | Buri (unused) | Dodo (unused) | Emau (unused) | Fere (unused) |
| Hibu (unused) | Ila (unused) | Kama (unused) | Lobu (unused) | Maila (unused) |
Season effects
| Name | Dates active | Peak classification | Sustained wind speeds |
Pressure | Areas affected | Damages (AUD) |
Damages (USD) |
Deaths | Refs |
|---|---|---|---|---|---|---|---|---|---|
| TL | 8 August | Tropical low | 35 km/h (25 mph) | 1005 hPa (29.68 inHg) | None | None | None | None | |
| Season Aggregates | |||||||||
| 1 system | 8 August – Season ongoing | 35 km/h (25 mph) | 1005 hPa (29.68 inHg) | None | None | None | |||
See also
- List of Southern Hemisphere cyclone seasons
- Atlantic hurricane seasons: 2017, 2018
- Pacific hurricane seasons: 2017, 2018
- Pacific typhoon seasons: 2017, 2018
- North Indian Ocean cyclone seasons: 2017, 2018
- 2017–18 South-West Indian Ocean cyclone season
- 2017–18 South Pacific cyclone season
References
- ↑ "Analysis Chart Archive". www.bom.gov.au. Retrieved 2017-08-08.
- 1 2 3 "WebCite query result". www.webcitation.org. Retrieved 2017-08-08.
- ↑ Meteorology, corporateName=Bureau of. "Tropical Cyclones". www.bom.gov.au. Retrieved 2017-08-08.
- ↑ "Meteo-France Tropical Bulletin (8 August 2017)" (PDF).
- 1 2 "WebCite query result". www.webcitation.org. Retrieved 2017-08-08.
- 1 2 "Tropical Cyclone Operational plan for the South Pacific & Southeast Indian Ocean, 2014 Edition" (PDF). WMO. Retrieved 2016-06-12.
- ↑ Gary Padgett (2008). "Monthly Global Tropical Cyclone Summary October". Australian Severe Weather. Retrieved 2013-07-01.
External links
- Australian Bureau of Meteorology
- Joint Typhoon Warning Center
- Tropical Cyclone Warning Center Jakarta (in Indonesian)