United Kingdom general election, 1924
| |||||||||||||||||||||||||||||||||||||||||||||||||
All 615 seats to the House of Commons 308 seats needed for a majority | |||||||||||||||||||||||||||||||||||||||||||||||||
| Turnout |
77.0% ( | ||||||||||||||||||||||||||||||||||||||||||||||||
| |||||||||||||||||||||||||||||||||||||||||||||||||
|
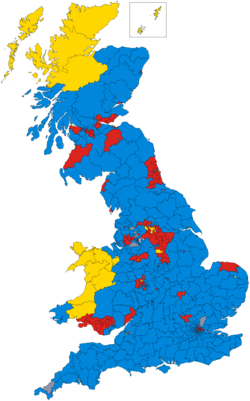
Colours denote the winning party, as shown in the main table of results. Northern Ireland and university constituencies not shown. | |||||||||||||||||||||||||||||||||||||||||||||||||
| |||||||||||||||||||||||||||||||||||||||||||||||||
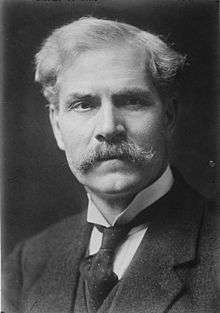
The 1924 United Kingdom general election was held on Wednesday 29 October 1924, as a result of the defeat of the Labour minority government, led by Ramsay MacDonald, in the House of Commons on a motion of no confidence. It was the third general election to be held in less than two years.
The Conservatives, led by Stanley Baldwin, performed dramatically better, in electoral terms, than in the 1923 general election and obtained a large parliamentary majority of 209. Labour, led by Ramsay MacDonald, lost 40 seats. The election also saw the Liberal Party, led by H. H. Asquith, lose 118 of their 158 seats which helped to polarise British politics between the Labour Party and Conservative Party.
The fourth party in terms of number of candidates, number of seats and number of votes were not a party but a group of former National Liberals standing under the Constitutionalist label. They favoured Conservative/Liberal co-operation. Three of the seven Constitutionalists elected, including Winston Churchill, had been opposed by official Liberal candidates, and sat as Conservatives after the election. The other four sat as Liberals.
The Conservative landslide victory and the Labour defeat in this general election has been, in part, attributed to the Zinoviev letter, a forgery, which was published in the Daily Mail four days before the election. However, it is difficult to prove that this had a major impact on the election result. The Labour vote increased by around one million popular votes in comparison to the 1923 general election, however, the increase in the number of popular votes for the Labour Party may be due, in part, to the party putting up eighty-seven more candidates than it did in the previous year's general election.
It is widely speculated that the combination of Labour forming its first government in January 1924 and the Zinoviev letter helped to stir up anti-socialist fears in Britain among many traditional anti-socialist Liberal voters, who then switched their support to the Conservative Party. This partly helps to explain the poor performance of the Liberal Party in the general election. The party also had financial difficulties which allowed it to contest only 339 seats, a lack of distinctive policies after the Conservative Party dropped their support for protected trade, and poor leadership under Asquith.
Results
| Candidates | Votes | ||||||||||
|---|---|---|---|---|---|---|---|---|---|---|---|
| Party | Leader | Standing | Elected | Gained | Unseated | Net | % of total | % | No. | Net % | |
| Conservative | Stanley Baldwin | 534 | 412 | + 154 | 66.991 | 46.8 | 7,418,983 | +8.8 | |||
| Labour | Ramsay MacDonald | 514 | 151 | − 40 | 24.552 | 33.3 | 5,281,626 | +2.6 | |||
| Liberal | H. H. Asquith | 339 | 40 | − 118 | 6.504 | 17.8 | 2,818,717 | −11.9 | |||
| Constitutionalist | N/A | 12 | 7 | 7 | 0 | + 7 | 1.138 | 1.2 | 185,075 | +1.1 | |
| Communist | Albert Inkpin | 8 | 1 | 1 | 0 | + 1 | 0.162 | 0.2 | 51,176 | +0.1 | |
| Sinn Féin | Éamon de Valera | 8 | 0 | 0 | 0 | 0 | 0.2 | 34,181 | N/A | ||
| Independent | N/A | 7 | 2 | 0 | 0 | 0 | 0.2 | 25,206 | −0.1 | ||
| NI Labour | Sam Kyle | 1 | 0 | 0 | 0 | 0 | 0.1 | 21,122 | N/A | ||
| Scottish Prohibition | Edwin Scrymgeour | 1 | 1 | 0 | 0 | 0 | 0.1 | 14,596 | 0.0 | ||
| Independent Liberal | N/A | 1 | 0 | 0 | 0 | 0 | 0.0 | 3,241 | −0.1 | ||
| Independent Labour | N/A | 1 | 0 | 0 | 0 | 0 | 0.0 | 1,775 | −0.1 | ||
| Independent Unionist | N/A | 1 | 0 | 0 | 0 | 0 | 0.0 | 517 | −0.1 | ||
| Nationalist | Joseph Devlin | 1 | 1 | 0 | 2 | − 2 | 0.0 | 0 | −0.4 | ||
Total votes cast: 15,856,215. Turnout 77.0%.[1] All parties shown. The only Irish Nationalist candidate was elected unopposed. The Conservatives include the Ulster Unionists.
Votes summary
Seats summary
Seats changing hands
- All comparisons are with the 1923 election.
- In some cases the change is due to the MP defecting to the gaining party. Such circumstances are marked with a *.
- In other circumstances the change is due to the seat having been won by the gaining party in a by-election in the intervening years, and then retained in 1923. Such circumstances are marked with a †.
1previous MP had defected to Labour by the time of the 1924 election
See also
- [[MPs elected in the UK general election, 2017
References
- F. W. S. Craig, British Electoral Facts: 1832-1987
- United Kingdom election results - summary results 1885-1909


