United Kingdom general election, 1885
| |||||||||||||||||||||||||||||||||||||||||||||||||
All 670 seats in the House of Commons 336 seats needed for a majority | |||||||||||||||||||||||||||||||||||||||||||||||||
| |||||||||||||||||||||||||||||||||||||||||||||||||
|
Colours denote the winning party. | |||||||||||||||||||||||||||||||||||||||||||||||||
| |||||||||||||||||||||||||||||||||||||||||||||||||
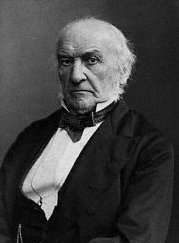


The 1885 United Kingdom general election was from 24 November to 18 December 1885. This was the first general election after an extension of the franchise and redistribution of seats. For the first time a majority of adult males could vote and most constituencies returned a single-member to Parliament. It saw the Liberals, led by William Ewart Gladstone, win the most seats, but not an overall majority. As the Irish Nationalists held the balance of power between them and the Conservatives, this exacerbated divisions within the Liberals over Irish Home Rule and led to a split and another general election the following year.
Results
| UK General Election 1885 | |||||||||||||||
|---|---|---|---|---|---|---|---|---|---|---|---|---|---|---|---|
| Candidates | Votes | ||||||||||||||
| Party | Standing | Elected | Gained | Unseated | Net | % of total | % | № | Net % | ||||||
| Liberal | 575 | 319 | |
47.4 | 2,199,198 | | |||||||||
| Conservative | 597 | 247 | |
43.5 | 2,020,927 | | |||||||||
| Irish Parliamentary | 91 | 86 | |
6.9 | 310,608 | | |||||||||
| Independent Liberal | 35 | 11 | 11 | 0 | |
1.3 | 55,652 | N/A | |||||||
| Independent Liberal and Crofters Party | 6 | 4 | 4 | 0 | |
0.4 | 16,551 | N/A | |||||||
| Independent Conservative | 8 | 2 | 2 | 0 | |
0.3 | 12,599 | N/A | |||||||
| Lib-Lab | 4 | 1 | 1 | 0 | |
0.2 | 8,232 | N/A | |||||||
| Independent | 6 | 0 | 0 | 0 | 0 | 0.1 | 6,570 | N/A | |||||||
| Independent Nationalist | 2 | 0 | 0 | 0 | 0 | 0.1 | 2,889 | N/A | |||||||
| Scottish Land Restoration | 5 | 0 | 0 | 0 | 0 | 0.0 | 2,359 | N/A | |||||||
| Irish Loyalist | 6 | 0 | 0 | 0 | 0 | 0.0 | 1,869 | N/A | |||||||
| Social Democratic Federation | 3 | 0 | 0 | 0 | 0 | 0.0 | 657 | N/A | |||||||
Total votes cast: 4,638,235. All parties shown.
Voting summary
Regional Results
.svg.png)
Largest party in each constituent country.
.svg.png)
Results within London & Middlesex.
Great Britain
| Party | Candidates | Unopposed | Seats | Seats change | Votes | % | % Change | |
|---|---|---|---|---|---|---|---|---|
| Liberal | 558 | 14 | 319 | 2,169,976 | 51.8 | |||
| Conservative | 532 | 8 | 233 | 1,909,424 | 45.6 | |||
| Other | 60 | 0 | 16 | 103,880 | 2.5 | |||
| Irish Parliamentary Party | 2 | 0 | 1 | 3,489 | 0.1 | |||
| Total | 1,152 | 22 | 569 | |
4,186,769 | 100 | ||
England
| Party | Candidates | Unopposed | Seats | Seats change | Votes | % | % Change | |
|---|---|---|---|---|---|---|---|---|
| Liberal | 452 | 4 | 238 | 1,809,665 | 51.4 | |||
| Conservative | 440 | 1 | 213 | 1,675,757 | 47.5 | |||
| Other | 26 | 0 | 4 | 40,990 | 1.0 | |||
| Irish Parliamentary Party | 2 | 0 | 1 | 3,489 | 0.1 | |||
| Total | 658 | 5 | 464 | |
491,540 | 100 | ||
Scotland

The results in Scotland, where several Liberal/Crofting MP's would dominate in the western Highlands.
| Party | Candidates | Unopposed | Seats | Seats change | Votes | % | % Change | |
|---|---|---|---|---|---|---|---|---|
| Liberal | 70 | 5 | 51 | 238,627 | 53.3 | |||
| Conservative | 55 | 0 | 8 | 151,137 | 34.3 | |||
| Other | 32 | 0 | 11 | 57,124 | 12.4 | |||
| Total | 157 | 5 | 70 | |
446,888 | 100 | ||
Wales

The Liberal party did particularly well in Wales, winning all but four seats.
| Party | Candidates | Unopposed | Seats | Seats change | Votes | % | % Change | |
|---|---|---|---|---|---|---|---|---|
| Liberal | 34 | 4 | 29 | 119,231 | 58.3 | |||
| Conservative | 29 | 0 | 4 | 79,690 | 38.9 | |||
| Lib-Lab | 1 | 0 | 1 | 3,859 | 1.9 | |||
| Other | 1 | 0 | 0 | 1,907 | 0.9 | |||
| Total | 65 | 4 | 34 | |
204,687 | 100 | ||
Ireland

In Ireland the Irish Nationalist IPP nearly won every seat. The party even did well in Protestant Ulster, where it won 17 of the provinces 32 seats.
| Party | Candidates | Unopposed | Seats | Seats change | Votes | % | % Change | |
|---|---|---|---|---|---|---|---|---|
| Irish Parliamentary Party | 92 | 19 | 85 | |
307,119 | 67.8 | | |
| Conservative | 70 | 2 | 16 | |
111,503 | 24.8 | | |
| Liberal | 14 | 0 | 0 | |
30,022 | 6.8 | | |
| Other | 10 | 0 | 0 | 2,822 | ||||
| Total | 186 | 21 | 101 | 451,466 | 100 | |||
Universities
| Party | Candidates | Unopposed | Seats | Seats change | Votes | % | % Change | |
|---|---|---|---|---|---|---|---|---|
| Conservative | 8 | 7 | 8 | 2,840 | 53.7 | |||
| Liberal | 2 | 1 | 1 | 2,453 | 46.3 | |||
| Total | 10 | 8 | 9 | |
5,293 | 100 | ||
Seats summary
See also
- List of MPs elected in the United Kingdom general election, 1885
- Parliamentary Franchise in the United Kingdom 1885–1918
- Representation of the People Act 1884
- Redistribution of Seats Act 1885
Further reading
- Walker, Brian. "The 1885 and 1886 General Elections in Ireland," History Ireland 13#6 (2005), pp. 36–40 in JSTOR
References
- F. W. S. Craig, British Electoral Facts: 1832–1987
- Spartacus: Political Parties and Election Results
- United Kingdom election results — summary results 1885–1979
| General elections |
|
|---|---|
| Local elections |
|
| European elections | |
| Referendums | |
This article is issued from
Wikipedia.
The text is licensed under Creative Commons - Attribution - Sharealike.
Additional terms may apply for the media files.