Timeline of the 1996 Atlantic hurricane season

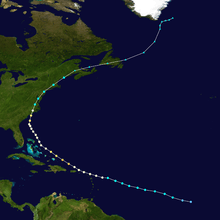
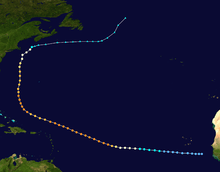
The 1996 Atlantic hurricane season had 13 named storms, of which 9 became hurricanes and 6 became major hurricanes (hurricanes that are classified as Category 3 or higher).[1] These major hurricanes were Bertha, Edouard, Fran, Hortense, Isidore, and Lili.[2][3][4][5][6][7] This timeline documents all the storm formations, strengthening, weakening, landfalls, extratropical transitions, as well as dissipation. The timeline also includes information that was not operationally released, meaning that information from post-storm reviews by the National Hurricane Center, such as information on a storm that was not operationally warned on, has been included. The season officially began on June 1, 1996, and ended on November 30 that same year.
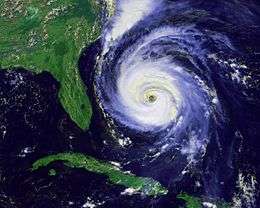
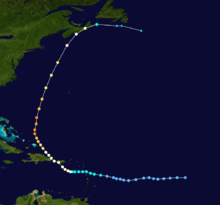
The season's most destructive storms were Hurricane Cesar, Hurricane Fran, and Hurricane Hortense. Hurricane Cesar (later known as Hurricane Douglas in the Eastern Pacific basin) was the deadliest storm of the season; it killed at least 51 people and caused severe damage in northern Colombia and southern Central America.[8] Hurricane Fran caused $3.2 billion (1996 USD; $4 billion 2009 USD) worth of damage in the United States, mostly in North Carolina, and killed 26 people.[4] Hurricane Hortense dropped torrential rainfall on southwestern Puerto Rico and the eastern Dominican Republic, killing 21 people and leaving behind $127 million (1996 USD; $174 million 2009 USD) in damage.[5] All three storms had their names retired by the World Meteorological Organization in the spring of 1997,[9] and were replaced with Cristobal, Fay, and Hanna for the 2002 season, respectively.
Timeline of storms

June
- June 1
- 12:00 am EDT (0400 UTC) – The 1996 Atlantic hurricane season officially begins.[10]
- June 17
- 2:00 pm EDT (1600 UTC) – Tropical depression One forms near eastern Grand Bahama.[11]
- June 18
- 8:00 pm EDT (0000 UTC June 19) – Tropical depression One strengthens into Tropical Storm Arthur.[11]
- June 19
- 8:00 pm EDT (0000 UTC June 20) – Tropical Storm Arthur makes landfall near Cape Lookout on the North Carolina Outer Banks with 40 mph (65 km/h)[nb 1] winds.[11]
- June 20
- 8:00 am EDT (1200 UTC) – Tropical Storm Arthur weakens into a tropical depression.[11]
- June 21
- 8:00 am EDT (1200 UTC) – Tropical Depression Arthur becomes extratropical about 350 nautical miles (400 miles, 645 km) north-northeast of Bermuda.[11]
July
- July 4
- July 5
- 8:00 am AST (1200 UTC) – Tropical depression Two strengthens into Tropical Storm Bertha.[2]

- July 7
- 2:00 pm AST (1800 UTC) – Tropical Storm Bertha strengthens into Hurricane Bertha as it moves across the Leeward and Virgin Islands.[2]
- July 9
- July 10
- 2:00 am EDT (0600 UTC) – Hurricane Bertha weakens into a Category 1 hurricane.[2]
- July 12
- 8:00 am EDT (1200 UTC) – Hurricane Bertha regains Category 2 intensity.[2]
- 4:00 pm EDT (2000 UTC) – Hurricane Bertha makes landfall between Wrightsville and Topsail Beaches in North Carolina with 105 mph (170 km/h) winds.[2]
- 8:00 pm EDT (0000 UTC July 13) – Hurricane Bertha weakens into a Category 1 hurricane.[2]
- July 13
- 2:00 am EDT (0600 UTC) – Hurricane Bertha weakens into a tropical storm.[2]
- July 14
- 8:00 am EDT (1200 UTC) – Tropical Storm Bertha becomes extratropical near New Brunswick.[2]
- July 24

- 2:00 pm AST (1800 UTC) – Tropical depression Three forms just north of Isla Margarita.[8]
- July 25
- 8:00 am EDT (1200 UTC) – Tropical depression Three strengthens into Tropical Storm Cesar.[8]
- July 27
- 8:00 am EDT (1200 UTC) – Tropical Storm Cesar strengthens into Hurricane Cesar.[8]
- July 28
- 12:00 am EDT (0400 UTC) – Hurricane Cesar makes landfall just north of Bluefields, Nicaragua, with 85 mph (135 km/h) winds.[8]
- 8:00 am EDT (1200 UTC) – Hurricane Cesar weakens into a tropical storm.[8]
- 7:00 pm CDT (0000 UTC July 29) – Tropical Storm Cesar completes its trek across Nicaragua, and becomes Tropical Storm Douglas in the Eastern Pacific.[8]
August
- August 19
- 2:00 am EDT (0600 UTC) – Tropical depression Four forms in the northwestern Caribbean Sea.[12]
- 2:00 pm EDT (1800 UTC) – Tropical depression Four strengthens into Tropical Storm Dolly.[12]
- 2:00 pm AST (1800 UTC) – Tropical depression Five forms about 100 miles (160 km) west of the Senegal/Guinea-Bissau border.[3]
- August 20
- 12:30 pm CDT (1730 UTC) – Tropical Storm Dolly strengthens into Hurricane Dolly as it makes its first landfall near Punta Herrero, Mexico with 75 mph (120 km/h) winds.[12]
- 7:00 pm CDT (0000 UTC August 21) – Hurricane Dolly weakens into a tropical storm.[12]
- August 21
- August 22
- 2:00 am AST (0600 UTC) – Tropical depression Five, which formed about 100 miles (160 km) west of the Senegal/Guinea-Bissau border on August 19, strengthens into Tropical Storm Edouard.[3]
- August 23
- 7:00 am CDT (1200 UTC) – Tropical Storm Dolly regains hurricane status as it makes its second landfall midway between Tampico, Tamaulipas, and Tuxpan, Veracruz, with 80 mph (130 km/h) winds.[12]
- 8:00 am AST (1200 UTC) – Tropical Storm Edouard strengthens into Hurricane Edouard.[3]
- 8:00 am AST (1200 UTC) – Tropical depression Six forms just southeast of the Cape Verde Islands.[4]
- 1:00 pm CDT (1800 UTC) – Hurricane Dolly weakens into a tropical storm.[12]
- 7:00 pm CDT (0000 UTC August 24) – Tropical Storm Dolly weakens into a tropical depression.[12]
- August 24

- August 25
- 12:00 am MDT (0600 UTC) – Tropical Depression Dolly dissipates over the eastern North Pacific Ocean.[12]
- 2:00 am AST (0600 UTC) – Hurricane Edouard reaches its peak intensity of 145 mph (230 km/h) winds and a pressure of 933 mbar, making it the strongest storm of the season.[3]
- 8:00 pm AST (0000 UTC August 26) – Tropical depression Seven forms south of the Cape Verde Islands.[13]
- August 27
- 8:00 am AST (1200 UTC) – Tropical depression Six strengthens into Tropical Storm Fran.[4]
- August 28
- 2:00 am AST (0600 UTC) – Tropical depression Seven strengthens into Tropical Storm Gustav.[13]
- 8:00 am AST (1200 UTC) – Hurricane Edouard weakens into a Category 3 hurricane.[3]
- August 29
- 8:00 am EDT (1200 UTC) – Hurricane Edouard regains Category 4 intensity.[3]
- 8:00 pm AST (0000 UTC August 30) – Tropical Storm Fran strengthens into Hurricane Fran.[4]
- August 30
- August 31
- 8:00 am AST (1200 UTC) – Tropical Storm Fran regains hurricane status.[4]
September

- September 1
- September 2
- September 3
- 2:00 am EDT (0600 UTC) – Tropical Storm Edouard becomes extratropical about 100 miles (160 km) south-southeast of the Maine/Canada.[3]
- 8:00 am AST (1200 UTC) – Tropical depression Eight forms about midway between the northern Leeward Islands and Senegal.[5]
- 2:00 pm EDT (1800 UTC) – Hurricane Fran reaches Category 2 intensity.[4]
- September 4
- 2:00 am EDT (0600 UTC) – Hurricane Fran reaches Category 3 intensity.[4]
- September 5
- 8:30 pm EDT (0030 UTC September 6) – Hurricane Fran makes landfall near Cape Fear, North Carolina with 115 mph (185 km/h) winds.[4]
- September 6
- September 7
- 2:00 am AST (0600 UTC) – Tropical depression Eight strengthens into Tropical Storm Hortense.[5]
- September 8
- September 9

- 2:00 am AST (0600 UTC) – Tropical Storm Hortense strengthens into Hurricane Hortense.[5]
- September 10
- 2:00 am EDT (0600 UTC) – Hurricane Hortense makes its first landfall near Guánica, Puerto Rico with 80 mph (130 km/h) winds.[5]
- September 11
- September 12
- 8:00 am EDT (1200 UTC – Hurricane Hortense reaches Category 4 intensity.[5]
- September 13
- September 14
- 2:00 pm AST (1800 UTC) – Hurricane Hortense weakens into a Category 1 hurricane.[5]
- 11:00 pm AST (0300 UTC September 15) – Hurricane Hortense makes its second landfall in Nova Scotia with 80 mph (130 km/h) winds.[5]
- September 15
- 8:00 am AST (1200 UTC) – Hurricane Hortense weakens into a tropical storm.[5]
- 2:00 pm AST (1800 UTC) – Tropical Storm Hortense becomes extratropical just south of Newfoundland.[5]
- September 24
- 8:00 am AST (1200 UTC) – Tropical depression Nine forms about 150 miles (240 km) south of Santiago, Cape Verde.[6]
- September 25
- 2:00 am AST (0600 UTC) – Tropical depression Nine strengthens into Tropical Storm Isidore.[6]
- September 26
- 2:00 am AST (0600 UTC) – Tropical Storm Isidore strengthens into Hurricane Isidore.[6]
- September 27
- September 28
- 8:00 am AST (1200 UTC) – Hurricane Isidore weakens into a Category 2 hurricane.[6]
- September 29
October
- October 1
- October 4
.gif)
- 1:00 pm CDT (1800 UTC) – Tropical Depression Ten forms about 70 miles (110 km) east of the Tamaulipas/Veracruz border.[14]
- October 6
- 1:00 pm CDT (1800 UTC) – Tropical Depression Ten strengthens into Tropical Storm Josephine.[14]
- October 7
- 11:30 pm EDT (0330 UTC October 8) – Tropical Storm Josephine makes landfall in Taylor County, Florida, with 70 mph (110 km/h) winds.[14]
- October 8
- October 11
- 8:00 am EDT (1200 UTC) – Tropical depression Eleven forms about midway between Belize and Great Swan Island.[15]
- 2:00 pm EDT (1800 UTC) – Tropical depression Eleven strengthens into Tropical Storm Kyle.[15]
- October 12
- 7:00 am CDT (1200 UTC) – Tropical Storm Kyle weakens into a tropical depression.[15]
- 1:00 pm CDT (1800 UTC) – Tropical Depression Kyle makes landfall near the Guatemala/Honduras border with 30 mph (50 km/h) winds.[15]
- 7:00 pm CDT (0000 UTC October 13) – Tropical Depression Kyle dissipates near where it made landfall.[15]
- October 14
- October 16
- 2:00 am EDT (0600 UTC) – Tropical depression Twelve strengthens into Tropical Storm Lili.[7]
- October 17
- 8:00 am EDT (1200 UTC) – Tropical Storm Lili strengthens into Hurricane Lili.[7]
- October 18
- 5:30 am EDT (0930 UTC) – Hurricane Lili reaches Category 2 intensity and makes landfall on the Zapata Peninsula with 100 mph (160 km/h) winds.[7]
- 2:00 pm EDT (1800 UTC) – Hurricane Lili weakens into a Category 1 hurricane.[7]
- 8:00 pm EDT (0000 UTC October 19) – Hurricane Lili regains Category 2 intensity.[7]
- October 19
- October 20

- October 25
- October 26
- 2:00 pm AST (1800 UTC) – Hurricane Lili weakens into a tropical storm.[7]
- October 27
- 1:00 am AST (0600 UTC) – Tropical Storm Lili becomes extratropical about 300 nautical miles (345 miles, 550 km) north-northwest of the Azores.[7]
November
- November 16
- November 19
- 1:00 am EST (0600 UTC) – Tropical depression Thirteen strengthens into Tropical Storm Marco.[16]
- November 20
- 1:00 am EST (0600 UTC) – Tropical Storm Marco strengthens into Hurricane Marco.[16]
- 1:00 pm EST (1800 UTC) – Hurricane Marco weakens into a tropical storm.[16]
- November 23
- 1:00 pm EST (1800 UTC) – Tropical Storm Marco weakens into a tropical depression.[16]
- November 24
- 7:00 am EST (1200 UTC) – Tropical Depression Marco regains tropical storm status.[16]
- November 26
- 7:00 am EST (1200 UTC) – Tropical Storm Marco weakens into a tropical depression.[16]
- 1:00 pm EST (1800 UTC) – Tropical Depression Marco dissipates about 100 miles (160 km) southwest of the Isle of Youth.[16]
- November 30
- 11:59 pm EST (0359 UTC) – The 1996 Atlantic hurricane season officially ends.[10]
See also
Notes
- ↑ The figures for maximum sustained winds and position estimates are rounded to the nearest 5 units (knots, miles, or kilometers), following the convention used in the National Hurricane Center's operational products for each storm. All other units are rounded to the nearest digit.
References
- ↑ "1996 Atlantic Ocean Tropical Storms and Hurricanes". National Data Buoy Center. 2006-06-16. Retrieved 2009-07-23.
- 1 2 3 4 5 6 7 8 9 10 11 12 Miles B. Lawrence (1996-11-09). "Preliminary Report: Hurricane Bertha". National Hurricane Center. Retrieved 2009-04-11.
- 1 2 3 4 5 6 7 8 9 10 11 12 13 14 15 Richard J. Pasch (1996-12-20). "Preliminary Report: Hurricane Edouard". National Hurricane Center. Retrieved 2009-07-21.
- 1 2 3 4 5 6 7 8 9 10 11 12 13 14 Max Mayfield (1996-10-10). "Preliminary Report: Hurricane Fran". National Hurricane Center. Retrieved 2009-04-04.
- 1 2 3 4 5 6 7 8 9 10 11 12 13 14 15 Lixion A. Avila (1996-10-23). "Preliminary Report: Hurricane Hortense". National Hurricane Center. Retrieved 2009-04-04.
- 1 2 3 4 5 6 7 8 9 10 11 Edward N. Rappaport (1996-11-01). "Preliminary Report: Hurricane Isidore". National Hurricane Center. Retrieved 2009-07-22.
- 1 2 3 4 5 6 7 8 9 10 11 12 13 14 15 16 Miles B. Lawrence (1996-11-18). "Preliminary Report: Hurricane Lili". National Hurricane Center. Retrieved 2009-07-22.
- 1 2 3 4 5 6 7 Lixion A. Avila (1996-08-26). "Preliminary Report: Hurricane Cesar". National Hurricane Center. Retrieved 2009-04-04.
- ↑ "FAQ: What names have been retired in the Atlantic and Eastern Pacific basins?". Atlantic Oceanographic and Meteorological Laboratory. Retrieved 2009-04-04.
- 1 2 "FAQ: When is hurricane season?". Atlantic Oceanographic and Meteorological Laboratory. Retrieved 2009-04-04.
- 1 2 3 4 5 Max Mayfield (1996-08-19). "Preliminary Report: Tropical Storm Arthur". National Hurricane Center. Retrieved 2009-04-04.
- 1 2 3 4 5 6 7 8 9 10 Edward N. Rappaport (1996-10-03). "Preliminary Report: Hurricane Dolly". National Hurricane Center. Retrieved 2009-07-21.
- 1 2 3 4 Miles B. Lawrence (1996-11-28). "Preliminary Report: Tropical Storm Gustav". National Hurricane Center. Retrieved 2009-07-22.
- 1 2 3 4 Richard J. Pasch (1997-02-21). "Preliminary Report: Tropical Storm Josephine". National Hurricane Center. Retrieved 2009-07-22.
- 1 2 3 4 5 Max Mayfield (1996-11-05). "Preliminary Report: Tropical Storm Kyle". National Hurricane Center. Retrieved 2009-07-22.
- 1 2 3 4 5 6 7 8 Lixion A. Avila (1996-12-03). "Preliminary Report: Hurricane Marco". National Hurricane Center. Retrieved 2009-07-22.
| Preceded by 1995 |
Atlantic hurricane seasons timelines 1996 |
Succeeded by 1998 |
| |||||||||||||