Error bar
Error bars are a graphical representation of the variability of data and are used on graphs to indicate the error, or uncertainty in a reported measurement. They give a general idea of how precise a measurement is, or conversely, how far from the reported value the true (error free) value might be. Error bars often represent one standard deviation of uncertainty, one standard error, or a certain confidence interval (e.g., a 95% interval). These quantities are not the same and so the measure selected should be stated explicitly in the graph or supporting text.
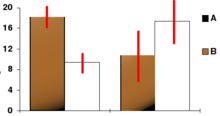
Error bars can be used to compare visually two quantities if various other conditions hold. This can determine whether differences are statistically significant. Error bars can also suggest goodness of fit of a given function, i.e., how well the function describes the data. Scientific papers in the experimental sciences are expected to include error bars on all graphs, though the practice differs somewhat between sciences, and each journal will have its own house style. It has also been shown that error bars can be used as a direct manipulation interface for controlling probabilistic algorithms for approximate computation.[1]
See also
References
- ↑ Sarkar, Advait; Blackwell, Alan F; Jamnik, Mateja; Spott, Martin (2015). "Interaction with uncertainty in visualisations". Eurographics/IEEE VGTC Conference on Visualization (EuroVis 2015) (The Eurographics Association). doi:10.2312/eurovisshort.20151138.
- Cumming, G.; Fidler, F.; Vaux, D. L. (2007). "Error bars in experimental biology". The Journal of Cell Biology 177 (1): 7–11. doi:10.1083/jcb.200611141. PMC 2064100. PMID 17420288.