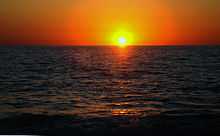
Yelapa
| Yelapa | |
|---|---|
| Village | |
 Location of Yelapa, in the State of Jalisco | |
| Coordinates: 20°29′18″N 105°26′43″W / 20.48833°N 105.44528°WCoordinates: 20°29′18″N 105°26′43″W / 20.48833°N 105.44528°W | |
| Country |
|
| Population | |
| • Total | 1,500 |
| Time zone | Mexico Standard Time |

Yelapa is a small beach town in Cabo Corrientes, Jalisco, Mexico. The village lies in the southernmost cove of the world's seventh largest bay, Bahía de Banderas (Bay of the Flags).[1]
Etymology
Yelapa’s name comes from an indigenous saying meaning "where two rivers meet the sea".[2]
Climate
Yelapa's climate is typical tropical wet and dry (Köppen climate classification Aw),[3] with a marked dry season in the winter. The high temperature and variations in humidity can make July through September nearly intolerable. It has pronounced wet and dry seasonal variation, with sudden monsoon-like rains from July through September, normally for a few hours in the evenings.
The average daily high temperature is 86 °F (30 °C); average daily low temperature is 70 °F (21 °C); average daily humidity is 75%. The rainy season extends from mid June through mid October, with most of the rain between July and September. August is the city's wettest month, with an average of 14 days with significant precipitation. Even during the rainy season precipitation tends to be concentrated in large rainstorms. Occasional tropical storms will bring thunderstorms to the city in November, though the month is typically dry. February, March and April are the months with the least cloud cover.[4] Prevailing winds are from the southwest, and most weather systems approaching Yelapa and surrounding areas are consequently weakened as they pass over Cabo Corriente. Thus even during the rainy season Yelapa's weather tends to be mild compared to other areas along the Mexican Pacific coast.
Hurricanes seldom strike Yelapa. In 2002, Hurricane Kenna, a category 5 hurricane, made landfall about 100 miles (160 km) northwest of Puerto Vallarta, and the surrounding cities suffered some damage from the resulting storm surge.
| Climate data for Yelapa, Jalisco, Mexico | |||||||||||||
|---|---|---|---|---|---|---|---|---|---|---|---|---|---|
| Month | Jan | Feb | Mar | Apr | May | Jun | Jul | Aug | Sep | Oct | Nov | Dec | Year |
| Record high °C (°F) | 35.0 (95) |
35.0 (95) |
36.0 (96.8) |
36.0 (96.8) |
43.5 (110.3) |
45.0 (113) |
45.0 (113) |
39.0 (102.2) |
38.0 (100.4) |
39.0 (102.2) |
37.0 (98.6) |
36.0 (96.8) |
45.0 (113) |
| Average high °C (°F) | 28.8 (83.8) |
29.0 (84.2) |
29.2 (84.6) |
29.9 (85.8) |
31.0 (87.8) |
32.3 (90.1) |
33.3 (91.9) |
33.7 (92.7) |
33.6 (92.5) |
33.6 (92.5) |
32.3 (90.1) |
29.9 (85.8) |
31.38 (88.48) |
| Daily mean °C (°F) | 22.8 (73) |
22.7 (72.9) |
23.1 (73.6) |
23.6 (74.5) |
25.6 (78.1) |
27.6 (81.7) |
28.1 (82.6) |
28.4 (83.1) |
28.3 (82.9) |
27.9 (82.2) |
26.0 (78.8) |
24.0 (75.2) |
25.67 (78.22) |
| Average low °C (°F) | 16.7 (62.1) |
16.3 (61.3) |
16.9 (62.4) |
17.2 (63) |
20.2 (68.4) |
22.8 (73) |
22.9 (73.2) |
23.0 (73.4) |
22.9 (73.2) |
22.2 (72) |
19.7 (67.5) |
18.0 (64.4) |
19.9 (67.83) |
| Record low °C (°F) | 11 (52) |
8 (46) |
12 (54) |
11 (52) |
11 (52) |
17 (63) |
21 (70) |
21 (70) |
18 (64) |
16 (61) |
13 (55) |
7 (45) |
7 (45) |
| Average rainfall mm (inches) | 33.8 (1.331) |
5.3 (0.209) |
2.0 (0.079) |
1.5 (0.059) |
15.4 (0.606) |
187.6 (7.386) |
328.1 (12.917) |
312.4 (12.299) |
370.0 (14.567) |
93.8 (3.693) |
19.8 (0.78) |
22.5 (0.886) |
1,392.2 (54.812) |
| Avg. rainy days (≥ 0.1 mm) | 2.2 | 0.7 | 0.6 | 0.2 | 1.0 | 10.8 | 16.4 | 15.2 | 15.6 | 5.1 | 1.4 | 1.9 | 71.1 |
| Average relative humidity (%) | 67 | 65 | 65 | 67 | 68 | 69 | 69 | 70 | 70 | 68 | 67 | 68 | 68 |
| Source #1: World Meteorological Organization.[5] | |||||||||||||
| Source #2: Weatherbase [6] | |||||||||||||
See also
External links
References
- ↑ http://www.yelapa.info/
- ↑ http://www.palapainyelapa.com/pages/history_project.html
- ↑ Wikimedia.org
- ↑ Climate data taken from the Weather Underground site for 2001-2006.
- ↑ Climatological Information for Puerto Vallarta, World Meteorological Organization. Retrieved 20 April 2013.
- ↑ "Climate Statistics for Puerto Vallarta, Jalisco, Mexico (closest city on record to Yelapa, Mexico)". Retrieved April 20, 2013.
