Wyre Forest District Council election, 2012
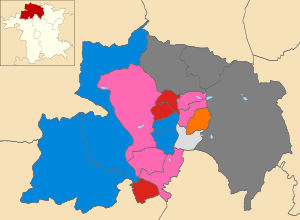
Map of the results of the 2012 Wyre Forest District Council election. Health Concern in pink,
Conservatives in blue,
Labour in red,
Liberals in orange and independent in light grey. Wards in dark grey were not contested in 2012.
The 2012 Wyre Forest District Council election took place on 3 May 2012 to elect members of Wyre Forest District Council in Worcestershire, England. One third of the council was up for election and the Conservative party lost overall control of the council to no overall control.[1]
After the election, the composition of the council was
Background
After the May 2011 Wyre Forest District Council election the Conservatives had a majority on the council with 24 councillors, compared to 6 for Labour, 5 Liberals, 4 Health Concern and 3 independents.[3] However later that month one of the Liberal councillors, Graham Ballinger, defected to Health Concern.[4] A further change then came in July 2011, when Mumshad Ahamed, who had sat as an independent councillor since being expelled from the Conservative group in June 2009, joined the Labour party.[5]
14 of the 42 seats on the council were contested in 2012,[6] with the Conservatives, Labour and Health Concern having candidates for every seat.[7] The Conservatives defended 8 of the 14 seats, with 3 members of the council cabinet, Nathan Desmond, Marcus Hart and Julian Phillips, standing for re-election.[7]
Election result
The Conservatives lost four of the eight seats they were defending and so no longer had a majority on the council as they were left with 20 of the 42 councillors.[8] Health Concern were the main beneficiaries picking up three seats and holding two more to have 8 seats on the council.[8] This pulled them level to Labour who also had 8 councillors after making a gain of one seat, with Labour coming within five votes of taking another seat in Oldington and Foley Park from the Coonservatives.[8] Independent Helen Dyke held her seat, while the only Liberal councillor to defend a seat, group leader Fran Oborski, successfully defended it after 39 years on the council.[8]
| Wyre Forest local election result 2012[2][9] |
| Party |
Seats |
Gains |
Losses |
Net gain/loss |
Seats % |
Votes % |
Votes |
+/− |
| |
Health Concern |
5 |
3 |
0 |
+3 |
35.7 |
31.2 |
6,640 |
+10.1% |
| |
Conservative |
4 |
0 |
4 |
-4 |
28.6 |
27.8 |
5,912 |
-10.8% |
| |
Labour |
3 |
2 |
1 |
+1 |
21.4 |
26.0 |
5,529 |
+2.1% |
| |
Liberal |
1 |
0 |
0 |
0 |
7.1 |
5.4 |
1,145 |
-0.5% |
| |
Independent |
1 |
0 |
0 |
0 |
7.1 |
3.9 |
826 |
+0.2% |
| |
UKIP |
0 |
0 |
0 |
0 |
0 |
3.3 |
692 |
+1.4% |
| |
Green |
0 |
0 |
0 |
0 |
0 |
2.3 |
484 |
+0.6% |
| |
Liberal Democrat |
0 |
0 |
0 |
0 |
0 |
0.2 |
34 |
-3.1% |
Ward results
| Aggborough and Spennells[9] |
| Party |
Candidate |
Votes |
% |
±% |
|
Independent |
Helen Dyke |
826 |
50.0 |
+12.4 |
|
Health Concern |
Keith Robertson |
323 |
19.5 |
+9.6 |
|
Conservative |
Madeline Craddock |
270 |
16.3 |
-9.5 |
|
Labour |
Vicky Smith |
173 |
10.5 |
-0.3 |
|
Green |
Ronald Lee |
61 |
3.7 |
+3.7 |
| Majority |
503 |
30.4 |
+18.6 |
| Turnout |
1,653 |
31.4 |
-11.3 |
|
Independent hold |
Swing |
|
|
| Areley Kings[9] |
| Party |
Candidate |
Votes |
% |
±% |
|
Labour |
Jamie Shaw |
774 |
48.4 |
+13.6 |
|
Health Concern |
John Thomas |
467 |
29.2 |
-0.4 |
|
Conservative |
Ken Henderson |
357 |
22.3 |
-10.6 |
| Majority |
307 |
19.2 |
+17.2 |
| Turnout |
1,598 |
33.7 |
-9.1 |
|
Labour hold |
Swing |
|
|
| Bewdley and Arley[9] |
| Party |
Candidate |
Votes |
% |
±% |
|
Conservative |
Julian Phillips |
772 |
41.1 |
-0.9 |
|
Health Concern |
Linda Candlin |
657 |
35.0 |
+9.9 |
|
Labour |
Robert Ireland |
448 |
23.9 |
-3.4 |
| Majority |
115 |
6.1 |
-8.6 |
| Turnout |
1,877 |
34.9 |
-11.7 |
|
Conservative hold |
Swing |
|
|
| Broadwaters[9] |
| Party |
Candidate |
Votes |
% |
±% |
|
Health Concern |
Mary Rayner |
619 |
37.8 |
+11.2 |
|
Labour |
Mumshad Ahmed |
581 |
35.5 |
+6.8 |
|
Conservative |
Juliet Smith |
277 |
16.9 |
-8.0 |
|
Liberal |
Esther Smart |
81 |
4.9 |
-2.0 |
|
Green |
Louise Ryan |
80 |
4.9 |
+0.7 |
| Majority |
38 |
2.3 |
|
| Turnout |
1,638 |
27.5 |
-7.8 |
|
Health Concern gain from Labour |
Swing |
|
|
| Greenhill[9] |
| Party |
Candidate |
Votes |
% |
±% |
|
Health Concern |
Graham Ballinger |
511 |
32.1 |
+16.5 |
|
Labour |
Steven Walker |
426 |
26.8 |
+4.1 |
|
Liberal |
Rachel Lewis |
296 |
18.6 |
-5.4 |
|
Conservative |
Sue Meekings |
273 |
17.2 |
-15.6 |
|
Green |
Alexandra Heelis |
85 |
5.3 |
+0.5 |
| Majority |
85 |
5.3 |
|
| Turnout |
1,591 |
25.5 |
-9.5 |
|
Health Concern hold |
Swing |
|
|
| Habberley and Blakebrook[9] |
| Party |
Candidate |
Votes |
% |
±% |
|
Labour |
Barry McFarland |
656 |
36.4 |
-1.5 |
|
Conservative |
Ken Prosser |
524 |
29.1 |
-6.7 |
|
Health Concern |
Anthony Greenfield |
404 |
22.4 |
+1.9 |
|
UKIP |
Neil Jukes |
178 |
9.9 |
+9.9 |
|
Green |
Dave Finch |
38 |
2.1 |
+0.0 |
| Majority |
132 |
7.3 |
+5.2 |
| Turnout |
1,800 |
34.6 |
-10.7 |
|
Labour gain from Conservative |
Swing |
|
|
| Lickhill[9] |
| Party |
Candidate |
Votes |
% |
±% |
|
Health Concern |
Brian Glass |
841 |
52.9 |
+8.9 |
|
Conservative |
Dave Little |
446 |
28.1 |
-10.7 |
|
Labour |
Rob Lloyd |
303 |
19.1 |
+1.8 |
| Majority |
395 |
24.8 |
+19.5 |
| Turnout |
1,590 |
29.0 |
-10.0 |
|
Health Concern hold |
Swing |
|
|
| Mitton[9] |
| Party |
Candidate |
Votes |
% |
±% |
|
Health Concern |
Cliff Brewer |
713 |
42.7 |
+7.8 |
|
Conservative |
John Holden |
567 |
34.0 |
-2.1 |
|
Labour |
Gary Watson |
278 |
16.7 |
-1.2 |
|
Green |
Stephen Brown |
110 |
6.6 |
+2.6 |
| Majority |
146 |
8.8 |
|
| Turnout |
1,668 |
28.0 |
-10.4 |
|
Health Concern gain from Conservative |
Swing |
|
|
| Offmore and Comberton[9] |
| Party |
Candidate |
Votes |
% |
±% |
|
Liberal |
Frances Oborski |
768 |
43.6 |
-0.2 |
|
Health Concern |
John Stevenson |
444 |
25.2 |
+25.2 |
|
Conservative |
Greta Smith |
282 |
16.0 |
-19.6 |
|
Labour |
Lee Wright |
266 |
15.1 |
-5.6 |
| Majority |
324 |
18.4 |
+10.2 |
| Turnout |
1,760 |
32.4 |
-9.2 |
|
Liberal hold |
Swing |
|
|
| Oldington and Foley Park[9] |
| Party |
Candidate |
Votes |
% |
±% |
|
Conservative |
Nathan Desmond |
261 |
30.5 |
-2.9 |
|
Labour |
Sam Arnold |
256 |
29.9 |
+6.2 |
|
Health Concern |
Nicky Martin |
190 |
22.2 |
+0.9 |
|
UKIP |
Heather Lacy |
127 |
14.9 |
+14.9 |
|
Green |
Angela Hartwich |
21 |
2.5 |
+2.5 |
| Majority |
5 |
0.6 |
-9.1 |
| Turnout |
855 |
22.6 |
-24.9 |
|
Conservative hold |
Swing |
|
|
| Sutton Park[9] |
| Party |
Candidate |
Votes |
% |
±% |
|
Conservative |
Marcus Hart |
636 |
41.7 |
+1.5 |
|
Health Concern |
Chris Thomas |
332 |
21.8 |
+2.8 |
|
Labour |
Lynn Hyde |
307 |
20.1 |
+2.9 |
|
UKIP |
Michael Wrench |
196 |
12.9 |
+2.8 |
|
Green |
Mike Whitbread |
53 |
3.5 |
+0.5 |
| Majority |
304 |
19.9 |
-1.3 |
| Turnout |
1,524 |
26.7 |
-9.5 |
|
Conservative hold |
Swing |
|
|
| Wribbenhall[9] |
| Party |
Candidate |
Votes |
% |
±% |
|
Health Concern |
Liz Davies |
476 |
37.0 |
+12.0 |
|
Conservative |
Andy Tromans |
410 |
31.9 |
-12.7 |
|
Labour |
Paul Gittens |
401 |
31.2 |
+13.7 |
| Majority |
66 |
5.1 |
|
| Turnout |
1,287 |
31.9 |
-39.3 |
|
Health Concern gain from Conservative |
Swing |
|
|
References