Wyre Forest District Council election, 2011
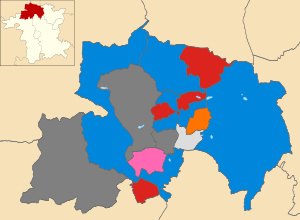
Map of the results of the 2011 Wyre Forest District Council election.
Conservatives in blue,
Labour in red, Health Concern in pink,
Liberals in orange and independent in light grey. Wards in dark grey were not contested in 2011.
The 2011 Wyre Forest District Council election took place on 5 May 2011 to elect members of Wyre Forest District Council in Worcestershire, England. One third of the council was up for election and the Conservative party stayed in overall control of the council.[1]
After the election, the composition of the council was
Background
After the last election in 2010 the Conservatives had a majority on the council with 23 seats, compared to 8 for Health Concern, 5 Liberals, 3 Labour, 2 Liberal Democrats and 1 independent.[3] However in late May 2010 the leader of Health Concern on the council, Howard Martin, left the party to sit as an independent and went on to join Labour in September 2010.[4] Another change came in March 2011 when both of the Liberal Democrat councillors, husband and wife Peter and Helen Dyke, left the party to become independents due to disillusionment with the national Conservative-Liberal Democrat coalition.[5]
Election result
The Conservatives retained a majority on the council with 24 councillors and gained a seat from Health Concern in Mitton.[2][6][7] Labour were the other party to make gains, taking an extra 2 seats, including gaining Areley Kings from Health Concern by 39 votes.[2][8] This made Labour the second largest party on the council with six seats, while Health Concern dropped three to have four seats.[9] Meanwhile Peter Dyke held Aggborough and Spennells as an independent, after having left the Liberal Democrats earlier in the year.[10]
| Wyre Forest local election result 2011[2][11] |
| Party |
Seats |
Gains |
Losses |
Net gain/loss |
Seats % |
Votes % |
Votes |
+/− |
| |
Conservative |
7 |
1 |
0 |
+1 |
50.0 |
38.6 |
10,669 |
-0.5% |
| |
Labour |
4 |
2 |
0 |
+2 |
28.6 |
23.9 |
6,617 |
+5.3% |
| |
Health Concern |
1 |
0 |
3 |
-3 |
7.1 |
21.1 |
5,825 |
-3.7% |
| |
Liberal |
1 |
0 |
0 |
0 |
7.1 |
5.9 |
1,634 |
-1.0% |
| |
Independent |
1 |
0 |
0 |
0 |
7.1 |
3.7 |
1,012 |
+3.7% |
| |
Liberal Democrat |
0 |
0 |
0 |
0 |
0 |
3.3 |
909 |
-6.7% |
| |
UKIP |
0 |
0 |
0 |
0 |
0 |
1.9 |
512 |
+1.9% |
| |
Green |
0 |
0 |
0 |
0 |
0 |
1.7 |
462 |
+0.1% |
Ward results
| Aggborough and Spennells[11] |
| Party |
Candidate |
Votes |
% |
±% |
|
Independent |
Peter Dyke |
831 |
37.6 |
+37.6 |
|
Conservative |
Gill Onslow |
570 |
25.8 |
-12.3 |
|
Labour |
Dan Watson |
239 |
10.8 |
-0.1 |
|
Health Concern |
Liz Davies |
220 |
9.9 |
-6.8 |
|
Liberal Democrat |
Michael Troth |
203 |
9.2 |
-25.1 |
|
UKIP |
Tony Baker |
149 |
6.7 |
+6.7 |
| Majority |
261 |
11.8 |
|
| Turnout |
2,212 |
42.7 |
-25.3 |
|
Independent hold |
Swing |
|
|
| Broadwaters[11] |
| Party |
Candidate |
Votes |
% |
±% |
|
Labour |
Adrian Sewell |
602 |
28.7 |
+6.4 |
|
Health Concern |
Mary Rayner |
558 |
26.6 |
-11.8 |
|
Conservative |
Juliet Smith |
521 |
24.9 |
-7.8 |
|
Independent |
Steven Walker |
181 |
8.6 |
+8.6 |
|
Liberal |
Mark Haynes |
144 |
6.9 |
+6.9 |
|
Green |
Phil Oliver |
89 |
4.2 |
-2.4 |
| Majority |
44 |
2.1 |
|
| Turnout |
2,095 |
35.3 |
-23.7 |
|
Labour gain from Health Concern |
Swing |
|
|
| Cookley[11] |
| Party |
Candidate |
Votes |
% |
±% |
|
Labour |
Christopher Nicholls |
538 |
55.5 |
+8.6 |
|
Conservative |
Greta Smith |
235 |
24.2 |
+0.8 |
|
Health Concern |
Les Rising |
197 |
20.3 |
+6.9 |
| Majority |
303 |
31.2 |
+7.7 |
| Turnout |
970 |
47.4 |
-1.0 |
|
Labour hold |
Swing |
|
|
| Greenhill[11] |
| Party |
Candidate |
Votes |
% |
±% |
|
Conservative |
Paul Harrison |
701 |
32.8 |
+1.4 |
|
Liberal |
John Stevenson |
513 |
24.0 |
-17.7 |
|
Labour |
Vicky Smith |
484 |
22.7 |
+2.4 |
|
Health Concern |
Chris Thomas |
333 |
15.6 |
+15.6 |
|
Green |
Alexandra Heelis |
103 |
4.8 |
-1.8 |
| Majority |
188 |
8.8 |
|
| Turnout |
2,134 |
35.0 |
-26.8 |
|
Conservative hold |
Swing |
|
|
| Lickhill[11] |
| Party |
Candidate |
Votes |
% |
±% |
|
Health Concern |
Jim Parish |
925 |
44.0 |
+2.0 |
|
Conservative |
David Little |
813 |
38.7 |
-0.6 |
|
Labour |
Jennifer Knowles |
363 |
17.3 |
-1.4 |
| Majority |
112 |
5.3 |
+2.6 |
| Turnout |
2,101 |
39.0 |
-27.2 |
|
Health Concern hold |
Swing |
|
|
| Mitton[11] |
| Party |
Candidate |
Votes |
% |
±% |
|
Conservative |
Chris Rogers |
805 |
36.1 |
-9.9 |
|
Health Concern |
Cliff Brewer |
778 |
34.9 |
-0.9 |
|
Labour |
Gary Watson |
399 |
17.9 |
-0.4 |
|
UKIP |
Bill Jones |
156 |
7.0 |
+7.0 |
|
Green |
Steve Brown |
89 |
4.0 |
+4.0 |
| Majority |
27 |
1.2 |
-9.0 |
| Turnout |
2,227 |
38.4 |
-29.0 |
|
Conservative gain from Health Concern |
Swing |
|
|
References
|
|---|
| | Metropolitan boroughs |
- Barnsley
- Birmingham
- Bolton
- Bradford
- Bury
- Calderdale
- Coventry
- Doncaster
- Dudley
- Gateshead
- Kirklees
- Knowsley
- Leeds
- Liverpool
- Manchester
- Newcastle upon Tyne
- North Tyneside
- Oldham
- Rochdale
- Rotherham
- Salford
- Sandwell
- Sefton
- Sheffield
- Solihull
- South Tyneside
- St Helens
- Stockport
- Sunderland
- Tameside
- Trafford
- Wakefield
- Walsall
- Wigan
- Wirral
- Wolverhampton
|
|---|
| | Unitary authorities | |
|---|
| | District councils (England) | |
|---|
| | District councils (Northern Ireland) |
- Antrim
- Ards
- Armagh
- Ballymena
- Ballymoney
- Banbridge
- Belfast
- Carrickfergus
- Castlereagh
- Coleraine
- Cookstown
- Craigavon
- Derry
- Down
- Dungannon and South Tyrone
- Fermanagh
- Larne
- Limavady
- Lisburn
- Magherafelt
- Moyle
- Newry and Mourne
- Newtownabbey
- North Down
- Omagh
- Strabane
|
|---|
| | Mayoral elections | |
|---|
| | National Assembly elections | |
|---|
| | Referendums | |
|---|
|