Wyre Forest District Council election, 2007
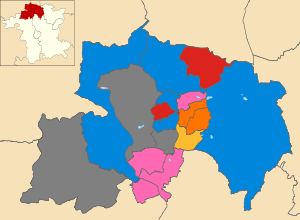
Map of the results of the 2007 Wyre Forest District Council election.
Conservatives in blue, Health Concern in pink,
Labour in red,
Liberal in orange and
Liberal Democrats in yellow. Wards in grey were not contested in 2007.
The 2007 Wyre Forest District Council election took place on 3 May 2007 to elect members of Wyre Forest District Council in Worcestershire, England. One third of the council was up for election and the council stayed under no overall control.[1]
After the election, the composition of the council was
Election result
The Conservatives remained the largest party on the council after winning 5 seats, but failing to gain a majority.[3] They gained a seat in Bewdley and Arley ward but lost one back in Mitton.[4] Health Concern were the only party to increase their number of seats after taking a seat from Labour by 11 votes in Areley Kings.[4][5] The defeated Labour councillor was their leader on the council, Jamie Shaw, who had been a councillor for 23 years.[4] The Liberals held both the seats they were defending, with Mike Price holding Offmore and Comberton where a long term councillor Mike Oborski had died in February.[6]
Following the election the leader of the council, Conservative Stephen Clee, stood down after 3 years in charge of the council after the disappointing results for his party.[7] He had been leader of his party in Wyre Forest for 6 years and was succeeded by John Campion.[7]
| Wyre Forest local election result 2007[8] |
| Party |
Seats |
Gains |
Losses |
Net gain/loss |
Seats % |
Votes % |
Votes |
+/− |
| |
Conservative |
5 |
1 |
1 |
0 |
35.7 |
35.7 |
8,486 |
-3.8% |
| |
Health Concern |
4 |
2 |
1 |
+1 |
28.6 |
30.8 |
7,327 |
-1.5% |
| |
Labour |
2 |
0 |
1 |
-1 |
14.3 |
15.8 |
3,760 |
-0.1% |
| |
Liberal |
2 |
0 |
0 |
0 |
14.3 |
10.4 |
2,463 |
+1.6% |
| |
Liberal Democrat |
1 |
0 |
0 |
0 |
7.1 |
6.0 |
1,434 |
+2.9% |
| |
Green |
0 |
0 |
0 |
0 |
0 |
0.7 |
169 |
+0.5% |
| |
Independent |
0 |
0 |
0 |
0 |
0 |
0.5 |
120 |
+0.3% |
Ward results
| Areley Kings[8] |
| Party |
Candidate |
Votes |
% |
±% |
|
Health Concern |
John Thomas |
648 |
33.7 |
-5.1 |
|
Labour |
James Shaw |
637 |
33.2 |
+10.2 |
|
Conservative |
Michael Partridge |
636 |
33.1 |
-5.1 |
| Majority |
11 |
0.5 |
|
| Turnout |
1,921 |
41.2 |
+3.7 |
|
Health Concern gain from Labour |
Swing |
|
|
| Broadwaters[8] |
| Party |
Candidate |
Votes |
% |
±% |
|
Health Concern |
Kenneth Stokes |
822 |
41.7 |
+9.1 |
|
Conservative |
Mumshad Ahmed |
498 |
25.3 |
-2.2 |
|
Liberal |
Shazu Miah |
399 |
20.2 |
-5.6 |
|
Labour |
Paul Mills |
253 |
12.8 |
-1.4 |
| Majority |
324 |
16.4 |
+11.3 |
| Turnout |
1,972 |
38.1 |
+5.6 |
|
Health Concern hold |
Swing |
|
|
| Cookley[8] |
| Party |
Candidate |
Votes |
% |
±% |
|
Labour |
Christopher Nicholls |
448 |
46.9 |
+0.2 |
|
Conservative |
Julian Phillips |
224 |
23.4 |
-8.4 |
|
Health Concern |
Caroline Godfrey |
128 |
13.4 |
-8.2 |
|
Independent |
Stephen Rushton |
120 |
12.6 |
+12.6 |
|
Liberal Democrat |
Vicky Dixon |
36 |
3.8 |
+3.8 |
| Majority |
224 |
23.5 |
+8.6 |
| Turnout |
956 |
48.4 |
-2.0 |
|
Labour hold |
Swing |
|
|
| Franche[8] |
| Party |
Candidate |
Votes |
% |
±% |
|
Conservative |
Anne Hingley |
1,087 |
50.4 |
+16.3 |
|
Health Concern |
Christopher Thomas |
578 |
26.8 |
-12.3 |
|
Labour |
Leroy Wright |
403 |
18.7 |
-8.1 |
|
Liberal |
Kevin Hill |
90 |
4.2 |
+4.2 |
| Majority |
509 |
23.6 |
|
| Turnout |
2,158 |
39.7 |
-1.5 |
|
Conservative hold |
Swing |
|
|
| Greenhill[8] |
| Party |
Candidate |
Votes |
% |
±% |
|
Liberal |
Paul Harrison |
971 |
52.3 |
+2.4 |
|
Health Concern |
Margaret Bradley |
477 |
25.7 |
+2.8 |
|
Conservative |
Paul Marchant |
294 |
15.8 |
+0.4 |
|
Green |
Vicky Dunn |
114 |
6.1 |
+6.1 |
| Majority |
494 |
26.6 |
-0.4 |
| Turnout |
1,856 |
31.1 |
-1.1 |
|
Liberal hold |
Swing |
|
|
| Habberley and Blakebrook[8] |
| Party |
Candidate |
Votes |
% |
±% |
|
Labour |
Michael Kelly |
736 |
35.6 |
+10.2 |
|
Health Concern |
Elizabeth Davies |
641 |
31.0 |
-7.9 |
|
Conservative |
Arthur Buckley |
590 |
28.5 |
-7.2 |
|
Liberal |
Alane Harvey |
102 |
4.9 |
+4.9 |
| Majority |
95 |
4.6 |
|
| Turnout |
2,069 |
39.8 |
-2.0 |
|
Labour hold |
Swing |
|
|
| Lickhill[8] |
| Party |
Candidate |
Votes |
% |
±% |
|
Health Concern |
Jill Fairbrother-Millis |
1,081 |
55.1 |
+1.4 |
|
Conservative |
David Little |
624 |
31.8 |
-1.9 |
|
Labour |
Donovan Giles |
207 |
10.6 |
-2.0 |
|
Liberal Democrat |
Clive Parsons |
50 |
2.5 |
+2.5 |
| Majority |
457 |
23.3 |
+3.3 |
| Turnout |
1,962 |
35.5 |
-0.1 |
|
Health Concern hold |
Swing |
|
|
| Offmore and Comberton[8] |
| Party |
Candidate |
Votes |
% |
±% |
|
Liberal |
Michael Price |
901 |
44.3 |
+6.4 |
|
Conservative |
Gillian Onslow |
686 |
33.8 |
-0.4 |
|
Health Concern |
James Parish |
291 |
14.3 |
-3.2 |
|
Labour |
Daniel Watson |
154 |
7.6 |
-2.8 |
| Majority |
235 |
10.5 |
+6.8 |
| Turnout |
2,032 |
37.8 |
-4.9 |
|
Liberal hold |
Swing |
|
|
References