World Football Elo Ratings
| World Football Elo Ratings | |||||
|---|---|---|---|---|---|
| Top 20 Rankings as of 19 April 2015[1] | |||||
| Rank | Team | Points | |||
| 1 | | 2104 | |||
| 2 | | 2041 | |||
| 3 | | 2036 | |||
| 4 | | 2004 | |||
| 5 | | 2000 | |||
| 6 | | 1932 | |||
| 7 | | 1931 | |||
| 8 | | 1912 | |||
| 9 | | 1903 | |||
| 10 | | 1894 | |||
| 11 | | 1888 | |||
| 12 | | 1876 | |||
| 13 | | 1867 | |||
| 14 | | 1853 | |||
| 15 | | 1827 | |||
| 16 | | 1814 | |||
| 17 | | 1813 | |||
| 18 | | 1804 | |||
| 19 | | 1783 | |||
| 20 | | 1774 | |||
| Full rankings | |||||
| Wikipedia | Elo ratings | ||||
| Notes | |||||
| 1 | ^ Change from previous year | ||||
| 2 | ^ Change from previous week | ||||
The World Football Elo Ratings is a ranking system for men's national teams in association football. The method used to rank teams is based upon the Elo rating system method but modified to take various football-specific variables into account. These ratings should not be confused with the FIFA World Rankings, which is more prevalent because it is the official rating system used by the international governing body of football to rank national teams.
The ratings consider all international "A" matches for which results could be found. Ratings tend to converge on a team's true strength relative to its competitors after about 30 matches.[2] Ratings for teams with fewer than 30 matches should be considered provisional.
The FIFA Women's World Rankings system uses a modified version of the Elo formula whereas the FIFA men's ranking system uses a non-Elo formula. A 2009 comparative study of eight methods found that the implementation of the Elo rating system described below had the highest predictive capability for football matches, while the men's FIFA ranking method performed poorly.[3]
Top 60 ranking
The following table shows World Football Elo Ratings on 15 April 2015, using data from the World Football Elo Ratings web site.[4]
Each national team's FIFA World Rankings are shown as they were on 09 April 2015.[5]
Strongest teams since the mid to late 1960s
Time averaged Elo or Elo-like scores are routinely used to compare chess player strengths.[6][7][8] The following is a list of the national teams with the highest average Elo score from 1 January 1970 to 1 May 2015. Before this time intercontinental play was fairly limited and many nations in Africa, North America, and Asia had played too few games yet to create a representative Elo score. Since Elo scores reflect past accomplishments, the table represents the relative strength of national teams since the mid to late 1960s.
|
|
|
List of number one teams
The following is the list of nations who have achieved the number one position in the World Football Elo Ratings since 2000:
|
|
|
Ranking by days as leader since 1 January 2000
| Nation | days | Last Date as Leader |
|---|---|---|
| | 2464 | 8 July 2014 |
| | 1523 | 12 October 2013 |
| | 1115 | 10 July 2007 |
| | 316 | 14 July 2007 |
| | 297 | Current |
| | 114 | 4 July 2014 |
| | 43 | 15 August 2006 |
| | 8 | 7 June 2005 |
All-time highest ratings
The following is a list of national football teams ranked by their highest Elo score ever reached.
|
|
Averages by decade
The table below shows the teams with the best average Elo score per decade (Jan 1 19X0 - Dec 31 19X9). Because the Elo scores take into account past achievements with an inertia of months, the averaging over a decade is more representative of the teams' strengths for a decade starting a few years earlier and ending with the latest results of the decade relatively underweighted. For instance, this partially explains England claiming #3 spot despite missing two WCs in the 70s, boosted by results legacy from the late 60s. Or conversely the surging of France in the late 90s and Spain in the late 00s not being fully reflected in that decade but rather on the subsequent one.
| Rank | 1920s | 1930s | 1940s [13] | 1950s | 1960s | |||||
|---|---|---|---|---|---|---|---|---|---|---|
| 1 | 1911 | 1976 | 2036 | 2025 | 1962 | |||||
| 2 | 1873 | 1970 | 2018 | 1998 | 1928 | |||||
| 3 | 1859 | 1899 | 1892 | 1996 | 1924 | |||||
| 4 | 1843 | 1868 | 1876 | 1917 | 1923 | |||||
| 5 | 1820 | 1867 | 1858 | 1870 | 1917 | |||||
| 6 | 1795 | 1859 | 1852 | 1856 | 1887 | |||||
| 7 | 1771 | 1841 | 1841 | 1853 | 1867 | |||||
| 8 | 1768 | 1814 | 1832 | 1850 | 1852 | |||||
| 9 | 1761 | 1810 | 1815 | 1817 | 1844 | |||||
| 10 | 1760 | 1785 | 1783 | 1815 | 1840 | |||||
| 11 | 1739 | 1767 | 1768 | 1799 | 1811 | |||||
| 12 | 1712 | 1759 | 1766 | 1796 | 1801 | |||||
| 13 | 1701 | 1685 | 1746 | 1791 | 1796 | |||||
| 14 | 1693 | 1682 | 1734 | 1753 | 1783 | |||||
| 15 | 1676 | 1678 | 1719 | 1728 | 1741 | |||||
| Rank | 1970s | 1980s | 1990s | 2000s | 2010s [14] | |||||
|---|---|---|---|---|---|---|---|---|---|---|
| 1 | 2059 | 1975 | 1998 | 1999 | 2077 | |||||
| 2 | 2040 | 1964 | 1988 | 1984 | 2054 | |||||
| 3 | 1948 | 1951 | 1952 | 1966 | 2044 | |||||
| 4 | 1933 | 1927 | 1928 | 1964 | 2022 | |||||
| 5 | 1888 | 1897 | 1920 | 1955 | 1966 | |||||
| 6 | 1883 | 1890 | 1904 | 1942 | 1915 | |||||
| 7 | 1878 | 1884 | 1901 | 1916 | 1879 | |||||
| 8 | 1869 | 1884 | 1901 | 1891 | 1876 | |||||
| 9 | 1861 | 1847 | 1869 | 1887 | 1870 | |||||
| 10 | 1851 | 1840 | 1869 | 1872 | 1869 | |||||
| 11 | 1838 | 1820 | 1843 | 1838 | 1847 | |||||
| 12 | 1831 | 1819 | 1836 | 1825 | 1845 | |||||
| 13 | 1830 | 1818 | 1829 | 1821 | 1841 | |||||
| 14 | 1809 | 1803 | 1826 | 1807 | 1836 | |||||
| 15 | 1803 | 1784 | 1825 | 1800 | 1809 | |||||
| 16 | 1793 | 1784 | 1813 | 1791 | 1808 | |||||
| 17 | 1771 | 1783 | 1810 | 1787 | 1783 | |||||
| 18 | 1766 | 1776 | 1784 | 1786 | 1773 | |||||
| 19 | 1766 | 1775 | 1777 | 1783 | 1768 | |||||
| 20 | 1755 | 1774 | 1773 | 1775 | 1765 | |||||
Highest rated matches
A list of the 15 matches between teams with the highest combined Elo ratings (the nations' points before the matches are given).
| Rank | Combined points | Nation 1 | Elo 1 | Nation 2 | Elo 2 | Score | Date | Occasion | Location |
|---|---|---|---|---|---|---|---|---|---|
| 1 | 4240 | 2180 | 2060 | 1 : 0 aet | 2014-07-13 | World Cup F | |||
| 2200 | 2040 | 2 : 4 | 2014-09-03 | Friendly[18] | |||||
| 3 | 4213 | 2101 | 2112 | 0 : 1 aet | 2010-07-11 | World Cup F | |||
| 4 | 4198 | 2100 | 2098 | 1 : 7 | 2014-07-08 | World Cup SF | | ||
| 5 | 4192 | 2064 | 2128 | 3 : 0 | 2013-06-30 | Confederations Cup F | | ||
| 6 | 4161 | 1995 | 2166 | 3 : 2 | 1954-07-04 | World Cup F | |||
| 7 | 4159 | 2051 | 2108 | 2 : 1 | 2010-07-02 | World Cup QF | | ||
| 8 | 4151 | 2061 | 2090 | 0 : 0 | 2011-06-04 | Friendly | |||
| 9 | 4149 | 2069 | 2080 | 0 : 1 | 1973-06-16 | Friendly | | ||
| 10 | 4135 | 2075 | 2060 | 0 : 0 | 2014-07-09 | World Cup SF | | ||
| 11 | 4130 | 2086 | 2044 | 1 : 0 | 2010-07-07 | World Cup SF | | ||
| 12 | 4121 | 2051 | 2070 | 1 : 0 | 1982-03-21 | Friendly | |||
| 13 | 4118 | 2108 | 2010 | 4 : 2 | 1954-06-27 | World Cup QF | |||
| 14 | 4116 | 2141 | 1975 | 4 : 2 | 1954-06-30 | World Cup SF | |||
| 15 | 4113 | 2079 | 2034 | 2 : 1 | 1974-07-07 | World Cup F | |
Biggest upsets
A list of the 15 matches with the biggest point exchange.[19] Since the importance of the match, the goal differential and the perceived home team advantage are factored in the point exchange, these are not necessarily the most surprising wins as expressed by the difference in Elo rating[20] The nations' points before the matches are given.
| Rank | Point exchange | Nation 1 | Elo 1 | Nation 2 | Elo 2 | Score | Date | Occasion | Location |
|---|---|---|---|---|---|---|---|---|---|
| 1 | 95 | 1621 | 1772 | 8 : 1 | 1924-05-29 | Olympic Games | |||
| 2 | 85 | 1148 | 1535 | 4 : 0 | 1980-02-23 | OFC Nations Cup | |||
| 1809 | 1964 | 6 : 1 | 1958-06-15 | World Cup | |||||
| 4 | 84 | 1583 | 1823 | 3 : 0 | 1936-08-05 | Olympic Games | |||
| 5 | 82 | 2100 | 2098 | 1 : 7 | 2014-07-08 | World Cup | |||
| 6 | 81 | 1598 | 1975 | 2 : 0 | 2006-06-17 | World Cup | |||
| 1189 | 1510 | 4 : 0 | 1972-05-14 | Asian Cup | |||||
| 8 | 79 | 1596 | 1986 | 3 : 0 | 1929-11-01 | Copa América | |||
| 9 | 78 | 1873 | 2054 | 3 : 0 | 1998-07-04 | World Cup | |||
| 1535 | 1865 | 3 : 1 | 1920-08-28 | Olympic Games | |||||
| 11 | 77 | 1785 | 2125 | 3 : 0 | 1959-12-12 | Copa América | |||
| 1540 | 1893 | 3 : 0 | 1937-01-10 | Copa América | |||||
| 13 | 76 | 1962 | 2088 | 5 : 1 | 2014-06-13 | World Cup | |||
| 1869 | 1771 | 0 : 5 | 2009-07-26 | Concacaf Gold Cup | |||||
| 1851 | 1650 | 0 : 2 | 1936-08-07 | Olympic Games | |||||
History
The Elo system, developed by Hungarian-American mathematician Dr. Árpád Élő, is used by FIDE, the international chess federation, to rate chess players, and by the European Go Federation, to rate Go players. In 1997 Bob Runyan adapted the Elo rating system to international football and posted the results on the Internet. He was also the first maintainer of the World Football Elo Ratings web site, now maintained by Kirill Bulygin.
Overview
The Elo system was adapted for football by adding a weighting for the kind of match, an adjustment for the home team advantage, and an adjustment for goal difference in the match result.
The factors taken into consideration when calculating a team's new rating are:
- The team's old rating
- The considered weight of the tournament
- The goal difference of the match
- The result of the match
- The expected result of the match
The different weights of competitions in descending order are:
- World Cup Finals
- Continental championships finals and Intercontinental tournaments
- World Cup and Continental championship qualifiers
- All other tournaments
- Friendly matches
The single difference is Elo giving a special treatment for minor tournaments, while FIFA consider them as friendly matches.
These ratings take into account all international "A" matches for which results could be found. Ratings tend to converge on a team's true strength relative to its competitors after about 30 matches. Ratings for teams with fewer than 30 matches should be considered provisional. Match data are primarily from International Football 1872 – present web site.
Basic calculation principles
The basic principle behind the Elo ratings is only in its simplest form similar to that of a league, unlike the FIFA tables who effectively run their table as a normal league table, but with weightings to take into account the other factors, the Elo system has its one formula which takes into account the factors mentioned above. There is no first step as in the FIFA system where a team immediately receives points for the result, there is just one calculation in the Elo system.
The ratings are based on the following formulae:

or

Where;
 | = The new team rating |
 | = The old team rating |
 | = Weight index regarding the tournament of the match |
 | = A number from the index of goal differences |
 | = The result of the match |
 | = The expected result |
 | = Points Change |
The number of Points Change is rounded to the nearest integer before updating the team rating.
Status of match
The status of the match is incorporated by the use of a weight constant. The weight is a constant regarding the "weight" or importance of a match, defined by which tournament the match is in, they are as follows;
| Tournament or Match type | Index (K) |
|---|---|
| World Cup | 60 |
| Continental Championship and Intercontinental Tournaments | 50 |
| World Cup and Continental qualifiers and major tournaments | 40 |
| All other tournaments | 30 |
| Friendly Matches | 20 |
Number of goals
The number of goals is taken into account by use of a goal difference index. G is increased by half if a game is won by two goals, and if the game is won by three or more goals by a number decided through the appropriate calculation shown below;
If the game is a draw or is won by one goal

If the game is won by two goals

If the game is won by three or more goals
- Where N is the goal difference
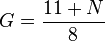
Table of examples:
| Goal Difference | Coefficient of K (G) |
|---|---|
| 0 | 1 |
| +1 | 1 |
| +2 | 1.5 |
| +3 | 1.75 |
| +4 | 1.875 |
| +5 | 2 |
| +6 | 2.125 |
| +7 | 2.25 |
| +8 | 2.375 |
| +9 | 2.5 |
| +10 | 2.625 |
Result of match
W is the result of the game (1 for a win, 0.5 for a draw, and 0 for a loss). This also holds when a game is won or lost on extra time. If the match is decided on penalties, however, the result of the game is considered a draw (W = 0.5).
Expected result of match
We is the expected result (win expectancy with a draw counting as 0.5) from the following formula:
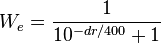
where dr equals the difference in ratings plus 100 points for a team playing at home. So dr of 0 gives 0.5, of 120 gives 0.666 to the higher-ranked team and 0.334 to the lower, and of 800 gives 0.99 to the higher-ranked team and 0.01 to the lower.
Examples
The same examples have been used on the FIFA World Rankings for a fair comparison. Some actual examples should help to make the methods of calculation clear. In this instance it is assumed that three teams of different strengths are involved in a small friendly tournament on neutral territory.
Before the tournament the three teams have the following point totals.
| Team | Points |
|---|---|
| A | 630 |
| B | 500 |
| C | 480 |
Thus, team A is by some distance the highest ranked of the three: The following table shows the points allocations based on three possible outcomes of the match between the strongest team A, and the somewhat weaker team B:
Example 1
Team A versus Team B (Team A stronger than Team B)
| Team A | Team B | Team A | Team B | Team A | Team B | |
| Score | 3 : 1 | 1 : 3 | 2 : 2 | |||
|---|---|---|---|---|---|---|
|
20 | 20 | 20 | 20 | 20 | 20 |
|
1.5 | 1.5 | 1.5 | 1.5 | 1 | 1 |
|
1 | 0 | 0 | 1 | 0.5 | 0.5 |
|
0.679 | 0.321 | 0.679 | 0.321 | 0.679 | 0.321 |
| Total (P) | +9.63 | -9.63 | -20.37 | +20.37 | -3.58 | +3.58 |
Example 2
Team B versus Team C (both teams approximately the same strength)
When the difference in strength between the two teams is less, so also will be the difference in points allocation. The following table illustrates how the points would be divided following the same results as above, but with two roughly equally ranked teams, B and C, being involved:
| Team B | Team C | Team B | Team C | Team B | Team C | |
| Score | 3 : 1 | 1 : 3 | 2 : 2 | |||
|---|---|---|---|---|---|---|
|
20 | 20 | 20 | 20 | 20 | 20 |
|
1.5 | 1.5 | 1.5 | 1.5 | 1 | 1 |
|
1 | 0 | 0 | 1 | 0.5 | 0.5 |
|
0.529 | 0.471 | 0.529 | 0.471 | 0.529 | 0.471 |
| Total (P) | +14.13 | -14.13 | -15.87 | +15.87 | -0.58 | +0.58 |
Note that Team B loses more ranking points by losing to Team C than by losing to Team A.
See also
- FIFA World Rankings
- FIFA Women's World Rankings
- Elo rating system
- Unofficial Football World Championships
- Statistical association football predictions
Notes and references
- ↑ "World Rankings". Elo. Retrieved 30 March 2015.
- ↑ "The World Football Elo Rating System". Eloratings.net. Retrieved 26 February 2012.
- ↑ J. Lasek, Z. Szlávik and S. Bhulai (2013), The predictive power of ranking systems in association football, Int. J. Applied Pattern Recognition1: 27-46.
- ↑ World Football Elo Ratings Elo.net. Retrieved: 2015-03-28.
- ↑ "FIFA/Coca-Cola World Ranking" (Press release). FIFA. 17 July 2014. Retrieved 2015-01-27.
- ↑ Arpad E. Elo, The Rating of Chessplayers, Past and Present, Arco, 1978. ISBN 0-668-04721-6.
- ↑ Arpad Elo, Chess Life, 1962.
- ↑ About the Chessmetrics Rating System, by Jeff Sonas
- ↑ Representing West Germany from 1949 to 1990
- ↑ Combined record of the USSR (1970-1992), the CIS (1992), and Russia national football teams (1992-present)
- ↑ Combined record of the Czechoslovakian (1970-1992) and Czech national football teams (1993-present)
- ↑ Combined record of Yugoslavia (1970-1992), Serbia and Montenegro (1994-2006) and Serbia national football teams (2006-present)
- ↑ In the 1940s, most national teams did not play games until after the end of World War II, making comparison of countries for this decade weak. For example, Mexico did not play any matches between Feb 1938 and July 1947, so that the average over the decade mostly reflects the single Elo rating achieved in February 1938
- ↑ (up to 1 May 2015)
- ↑ Combined record of Yugoslavia (1990-1992) and FR of Yugoslavia (1994-1999)
- ↑ Combined record of Czechoslovakia (1990-1992) and Czech national football teams (1993-1999)
- ↑ Combined record of the USSR (1990-1992), the CIS (1992), and Russia national football teams (1992-1999)
- ↑ "Germany to play Argentina in September friendly". The Star. 21 March 2014. Retrieved 15 July 2014.
- ↑ Source: World Football Elo Ratings: Biggest Upsets. Only matches between teams with at least 30 earlier matches each are included to allow a stabilized Elo rating. These criteria just disqualify the 4:0 Turkey:China match at the 1948 Olympic Games and the 7:1 Italy:Spain match at the 1928 Olympic Games, each with an 89 point exchange.
- ↑ In those terms, most surprising may have been the 2:1 win of Luxembourg (Elo rating 1005) over Switzerland (ER 1767) in a World Cup qualification match in September 2008 (a 762 point difference). In another World Cup qualifier in October 2004 Liechtenstein (ER 1032) held the 839 points higher rated Portuguese team (ER 1871) to a 2:2 draw.
External links
- World Football Elo ratings
- How the rankings are calculated
- Interactive Map of World Football Elo ratings
- FootballDatabase's World Club Ratings (using Elo Formula)
| ||||||||||||||||||||||||||||||||||||||||||||||
