Woolwich West (UK Parliament constituency)
| Woolwich West | |
|---|---|
|
Former Borough constituency for the House of Commons | |
| County | Greater London |
| 1918–1983 | |
| Number of members | One |
| Replaced by | Eltham |
| Created from | Woolwich |
Woolwich West was a borough constituency represented in the House of Commons of the Parliament of the United Kingdom from 1918 until 1983. It centred on Eltham, now in the Royal Borough of Greenwich in south-east London.
The constituency was formed for the 1918 general election, when the constituency of Woolwich was divided into Woolwich West and Woolwich East, and abolished in 1983. Although the boundaries changed, Woolwich West in effect became the new Eltham constituency.
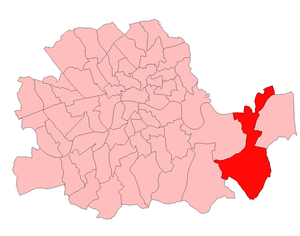
Woolwich West in the Parliamentary County of London from 1918 to 1949.
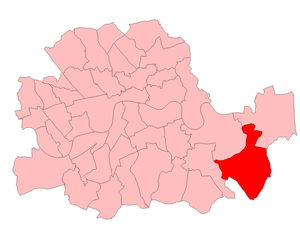
Woolwich West in the Parliamentary County of London from 1950 to 1974.
Members of Parliament
| Election | Member | Party | |
|---|---|---|---|
| 1918 | Sir Kingsley Wood | Conservative | |
| 1943 by-election | Francis Beech | Conservative | |
| 1945 | Henry Berry | Labour | |
| 1950 | William Steward | Conservative | |
| 1959 | Colin Turner | Conservative | |
| 1964 | Bill Hamling | Labour | |
| 1975 by-election | Peter Bottomley | Conservative | |
| 1983 | constituency abolished | ||
Elections
Elections in the 1970s
| 1979 General Election | |||||
|---|---|---|---|---|---|
| Party | Candidate | Votes | % | ±% | |
| Conservative | Peter Bottomley | 21,222 | 47.3 | -1.5 | |
| Labour | D Page | 18,613 | 41.5 | -0.6 | |
| Liberal | J Churchill | 4,363 | 9.7 | +4.4 | |
| National Front | M Skeggs | 630 | 1.4 | -1.0 | |
| Majority | 2,609 | 5.8 | -2.7 | ||
| Turnout | 79.6 | +5.7 | |||
| Conservative hold | Swing | -0.5 | |||
| Woolwich West by-election, 1975 | |||||
|---|---|---|---|---|---|
| Party | Candidate | Votes | % | ±% | |
| Conservative | Peter Bottomley | 17,280 | 48.8 | +10.2 | |
| Labour | Joseph Stanyer | 14,898 | 42.1 | -5.0 | |
| Liberal | Mrs Sheilagh Hobday | 1,884 | 5.3 | -9.0 | |
| National Front | Mrs Ruth Robinson | 856 | 2.4 | N/A | |
| Fellowship | Ronald Mallone | 218 | 0.6 | N/A | |
| English National | Frank Hansford-Miller | 140 | 0.4 | N/A | |
| C'tive, Anti-Common Market | Reginald Simmerson | 104 | 0.3 | N/A | |
| Independent | Peter Bishop | 41 | 0.1 | N/A | |
| Majority | 2,382 | 6.7 | |||
| Turnout | |||||
| Conservative gain from Labour | Swing | ||||
| 1974 (Oct) General Election | |||||
|---|---|---|---|---|---|
| Party | Candidate | Votes | % | ±% | |
| Labour | William Hamling | 19,614 | 47.1 | +3.0 | |
| Conservative | Peter Bottomley | 16,073 | 38.6 | -0.2 | |
| Liberal | JP Johnson | 5,962 | 14.3 | -2.9 | |
| Majority | 3,541 | 8.5 | +3.2 | ||
| Turnout | 73.9 | -8.0 | |||
| Labour hold | Swing | +1.6 | |||
| 1974 (Feb) General Election | |||||
|---|---|---|---|---|---|
| Party | Candidate | Votes | % | ±% | |
| Labour | William Hamling | 20,126 | 44.1 | -6.7 | |
| Conservative | Peter Bottomley | 17,690 | 38.8 | -10.5 | |
| Liberal | JP Johnson | 7,833 | 17.2 | +17.2 | |
| Majority | 2,436 | 5.3 | +3.8 | ||
| Turnout | 81.9 | +10.0 | |||
| Labour hold | Swing | +1.9 | |||
| 1970 General Election | |||||
|---|---|---|---|---|---|
| Party | Candidate | Votes | % | ±% | |
| Labour | William Hamling | 21,036 | 50.8 | -2.9 | |
| Conservative | MP Gaffney | 20,418 | 49.3 | +5.0 | |
| Majority | 618 | 1.5 | -7.9 | ||
| Turnout | 71.9 | -9.5 | |||
| Labour hold | Swing | -3.9 | |||
Elections in the 1960s
| 1966 General Election | |||||
|---|---|---|---|---|---|
| Party | Candidate | Votes | % | ±% | |
| Labour | William Hamling | 23,344 | 53.7 | +2.9 | |
| Conservative | MP Gaffney | 19,256 | 44.3 | -2.4 | |
| Fellowship | R Mallone | 906 | 2.1 | -0.4 | |
| Majority | 4,088 | 9.4 | +5.4 | ||
| Turnout | 81.4 | +0.1 | |||
| Labour hold | Swing | 2.6 | |||
| 1964 General Election | |||||
|---|---|---|---|---|---|
| Party | Candidate | Votes | % | ±% | |
| Labour | William Hamling | 22,420 | 50.8 | +6.1 | |
| Conservative | Colin Turner | 20,639 | 46.7 | -6.0 | |
| Fellowship | R Mallone | 1,112 | 2.5 | -0.1 | |
| Majority | 1,781 | 4.0 | |||
| Turnout | 81.3 | -3.5 | |||
| Labour gain from Conservative | Swing | 6.1 | |||
Elections in the 1950s
| 1959 General Election | |||||
|---|---|---|---|---|---|
| Party | Candidate | Votes | % | ±% | |
| Conservative | Colin Turner | 24,373 | 52.7 | +0.7 | |
| Labour | William Hamling | 20,678 | 44.7 | -3.3 | |
| Fellowship | R Mallone | 1,189 | 2.6 | +2.6 | |
| Majority | 3,695 | 8.0 | +3.9 | ||
| Turnout | 84.8 | +1.5 | |||
| Conservative hold | Swing | 2.0 | |||
| 1955 General Election | |||||
|---|---|---|---|---|---|
| Party | Candidate | Votes | % | ±% | |
| Conservative | William Steward | 23,981 | 52.0 | +2.7 | |
| Labour | William Hamling | 22,101 | 48.0 | +1.6 | |
| Majority | 1,880 | 4.1 | +1.3 | ||
| Turnout | 83.3 | +1.2 | |||
| Conservative hold | Swing | 0.5 | |||
| 1951 General Election | |||||
|---|---|---|---|---|---|
| Party | Candidate | Votes | % | ±% | |
| Conservative | William Steward | 23,385 | 49.3 | +2.7 | |
| Labour | John Silkin | 22,041 | 46.4 | +0.1 | |
| Liberal | D Phillips | 2,040 | 4.3 | -2.9 | |
| Majority | 1,344 | 2.8 | +2.5 | ||
| Turnout | 82.1 | -5.0 | |||
| Conservative hold | Swing | 1.3 | |||
| 1950 General Election | |||||
|---|---|---|---|---|---|
| Party | Candidate | Votes | % | ±% | |
| Conservative | William Steward | 21,257 | 46.6 | +8.2 | |
| Labour | Henry Berry | 21,118 | 46.3 | -15.0 | |
| Liberal | WR Roberts | 3,279 | 7.2 | +7.2 | |
| Majority | 139 | 0.3 | |||
| Turnout | 87.1 | +14.8 | |||
| Conservative gain from Labour | Swing | 11.6 | |||
Elections in the 1940s
| 1945 General Election | |||||
|---|---|---|---|---|---|
| Party | Candidate | Votes | % | ±% | |
| Labour | Henry Berry | 23,655 | 61.6 | +20.3 | |
| Conservative | Francis Beech | 14,771 | 38.4 | -20.3 | |
| Majority | 8,884 | 23.1 | |||
| Turnout | 72.3 | -3.5 | |||
| Labour gain from Conservative | Swing | 20.3 | |||
Elections in the 1930s
| 1935 General Election | |||||
|---|---|---|---|---|---|
| Party | Candidate | Votes | % | ±% | |
| Conservative | Sir Kingsley Wood | 24,649 | 58.7 | -5.9 | |
| Labour | G Wansborough | 17,373 | 41.3 | +5.9 | |
| Majority | 7,276 | 17.3 | -11.8 | ||
| Turnout | 75.8 | -1.6 | |||
| Conservative hold | Swing | -5.9 | |||
| 1931 General Election | |||||
|---|---|---|---|---|---|
| Party | Candidate | Votes | % | ±% | |
| Conservative | Sir Kingsley Wood | 26,441 | 64.6 | ||
| Labour | J Reeves | 14,520 | 35.4 | ||
| Majority | 11,921 | 29.1 | |||
| Turnout | 77.4 | ||||
| Conservative hold | Swing | ||||
References
| Parliament of the United Kingdom | ||
|---|---|---|
| Preceded by Spen Valley |
Constituency represented by the Chancellor of the Exchequer 1940–1943 |
Succeeded by Combined Scottish Universities |