Woodbridge (UK Parliament constituency)
| Sudbury | |
|---|---|
|
Former County constituency for the House of Commons | |
| County | Suffolk |
| Major settlements | Woodbridge |
| 1885–1950 | |
| Number of members | One |
| Replaced by | Sudbury & Woodbridge |
| Created from | East Suffolk |
Woodbridge was a county constituency centred on the town of Woodbridge in Suffolk. It returned one Member of Parliament (MP) to the House of Commons of the Parliament of the United Kingdom.
The constituency was created for the 1885 general election, and abolished for the 1950 general election. It was then largely replaced by the new Sudbury & Woodbridge constituency.
Members of Parliament
| Election | Member | Party | |
|---|---|---|---|
| 1885 | Robert Lacey Everett | Liberal | |
| 1886 | Robert Hamilton Lloyd-Anstruther | Conservative | |
| 1892 | Robert Lacey Everett | Liberal | |
| 1895 | E. G. Pretyman | Conservative | |
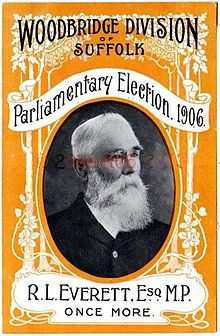
| 1906 | Robert Lacey Everett | Liberal | |
| Jan. 1910 | Robert Francis Peel | Conservative | |
| 1920 | Sir Arthur Churchman, Bt | Conservative | |
| 1929 | Clavering Fison | Conservative | |
| 1931 | Walter Ross-Taylor | Conservative | |
| 1945 | Hon. John Hare | Conservative | |
| 1950 | constituency abolished: see Sudbury and Woodbridge | ||
Election results
Elections in the 1900s

| General Election 1906: Woodbridge
Electorate | |||||
|---|---|---|---|---|---|
| Party | Candidate | Votes | % | ±% | |
| Liberal | Robert Lacey Everett | 5,527 | 50.8 | ||
| Conservative | E. G. Pretyman | 5,348 | 49.2 | ||
| Majority | 179 | 1.6 | |||
| Turnout | |||||
| Liberal gain from Conservative | Swing | ||||
Elections in the 1910s

| General Election 1918: Woodbridge[1]
Electorate 30,413 | |||||
|---|---|---|---|---|---|
| Party | Candidate | Votes | % | ±% | |
| Unionist | 8,654 | 55.8 | |||
| Liberal | Maj. William Rowley Elliston | 6,842 | 44.2 | ||
| Majority | 1,812 | 11.6 | |||
| Turnout | 51.0 | ||||
| Unionist hold | Swing | ||||
- denotes candidate who was endorsed by the Coalition Government
Elections in the 1920s
| Woodbridge by-election, 1920[2]
Electorate 30,300 | |||||
|---|---|---|---|---|---|
| Party | Candidate | Votes | % | ±% | |
| Unionist | Sir Arthur Charles Churchman | 9,898 | 53.2 | -2.6 | |
| Labour | Henry Devenish Harben | 8,707 | 46.8 | n/a | |
| Majority | 1,191 | 6.4 | |||
| Turnout | 61.4 | +10.4 | |||
| Unionist hold | Swing | ||||
| General Election 1922: Woodbridge[3]
Electorate 31,646 | |||||
|---|---|---|---|---|---|
| Party | Candidate | Votes | % | ±% | |
| Unionist | Sir Arthur Charles Churchman | 12,396 | 56.7 | +3.5 | |
| Labour | Edward John Cecil Neep | 9,476 | 43.3 | -3.5 | |
| Majority | 2,920 | 13.4 | +6.8 | ||
| Turnout | 69.1 | +7.7 | |||
| Unionist hold | Swing | +3.4 | |||
| General Election 1923: Woodbridge[4]
Electorate 32,067 | |||||
|---|---|---|---|---|---|
| Party | Candidate | Votes | % | ±% | |
| Unionist | Sir Arthur Charles Churchman | 10,606 | 46.7 | -10.0 | |
| Liberal | William Rowley Elliston | 7,328 | 32.2 | n/a | |
| Labour | Edward John Cecil Neep | 4,810 | 21.1 | -22.2 | |
| Majority | 3,278 | 14.5 | +1.1 | ||
| Turnout | 70.9 | +1.8 | |||
| Unionist hold | Swing | n/a | |||
| General Election 1924: Woodbridge[5]
Electorate 32,869 | |||||
|---|---|---|---|---|---|
| Party | Candidate | Votes | % | ±% | |
| Unionist | Sir Arthur Charles Churchman | 13,419 | 54.9 | +8.2 | |
| Liberal | William Rowley Elliston | 7,008 | 28.7 | -3.5 | |
| Labour | Sylvain Mayer | 3,998 | 16.4 | -4.7 | |
| Majority | 6,411 | 26.2 | +11.7 | ||
| Turnout | 74.3 | +3.4 | |||
| Unionist hold | Swing | +5.8 | |||
| General Election 1929: Woodbridge[6]
Electorate 43,181 | |||||
|---|---|---|---|---|---|
| Party | Candidate | Votes | % | ±% | |
| Unionist | Frank Guy Clavering Fison | 15,231 | 48.1 | -6.8 | |
| Liberal | Roger Thomas Baldwin Fulford | 10,904 | 34.5 | +5.8 | |
| Labour | Leonard Spero | 5,507 | 17.4 | +1.0 | |
| Majority | 4,327 | 13.6 | -12.6 | ||
| Turnout | 73.3 | -1.0 | |||
| Unionist hold | Swing | -6.3 | |||
Elections in the 1930s
| General Election 1931: Woodbridge[7]
Electorate 44,686 | |||||
|---|---|---|---|---|---|
| Party | Candidate | Votes | % | ±% | |
| Conservative | Walter Ross-Taylor | 25,654 | 81.3 | +33.2 | |
| Labour | Mrs I M N Keeble | 5,885 | 18.7 | +1.3 | |
| Majority | 19,769 | 62.6 | +49.0 | ||
| Turnout | 70.6 | -2.7 | |||
| Conservative hold | Swing | n/a | |||
| General Election 1935: Woodbridge[8]
Electorate 46,703 | |||||
|---|---|---|---|---|---|
| Party | Candidate | Votes | % | ±% | |
| Conservative | Walter Ross-Taylor | 22,715 | 72.1 | -9.2 | |
| Labour | A V Smith | 8,808 | 27.9 | +9.2 | |
| Majority | 13,907 | 44.2 | -18.4 | ||
| Turnout | 67.5 | +4.9 | |||
| Conservative hold | Swing | -9.2 | |||
General Election 1939/40: Another General Election was required to take place before the end of 1940. The political parties had been making preparations for an election to take place and by the Autumn of 1939, the following candidates had been selected;
- Conservative: Hon. John Hugh Hare
- Liberal: Douglas B Law[9]
- Labour: J M Stewart[10]
Elections in the 1940s
| General Election 1945: Woodbridge[11]
Electorate 47,891 | |||||
|---|---|---|---|---|---|
| Party | Candidate | Votes | % | ±% | |
| Conservative | Lt-Col. Hon. John Hugh Hare | 16,073 | 47.0 | -25.1 | |
| Labour | J M Stewart | 11,380 | 33.3 | +5.4 | |
| Liberal | Capt. Douglas B Law | 6,740 | 19.7 | n/a | |
| Majority | |||||
| Turnout | 71.4 | ||||
| Conservative hold | Swing | ||||
Sources
- ↑ British Parliamentary Election Results 1918-1949, FWS Craig
- ↑ British Parliamentary Election Results 1918-1949, FWS Craig
- ↑ British Parliamentary Election Results 1918-1949, FWS Craig
- ↑ British Parliamentary Election Results 1918-1949, FWS Craig
- ↑ British Parliamentary Election Results 1918-1949, FWS Craig
- ↑ British Parliamentary Election Results 1918-1949, FWS Craig
- ↑ British Parliamentary Election Results 1918-1949, FWS Craig
- ↑ British Parliamentary Election Results 1918-1949, FWS Craig
- ↑ The Liberal Magazine, 1939
- ↑ Report of the Annual Conference of the Labour Party, 1939
- ↑ British Parliamentary Election Results 1918-1949, FWS Craig
- Leigh Rayment's Historical List of MPs – Constituencies beginning with "W" (part 5)
- Craig, F. W. S. (1989) [1974]. British parliamentary election results 1885–1918 (2nd ed.). Chichester: Parliamentary Research Services. p. 395. ISBN 0-900178-27-2.
- Craig, F. W. S. (1983) [1969]. British parliamentary election results 1918–1949 (3rd ed.). Chichester: Parliamentary Research Services. p. 469. ISBN 0-900178-06-X.