Willesden West (UK Parliament constituency)
| Willesden West | |
|---|---|
|
Former Borough constituency for the House of Commons | |
| 1918–February 1974 | |
| Number of members | one |
| Replaced by | Brent East and Brent South |
| Created from | Harrow |
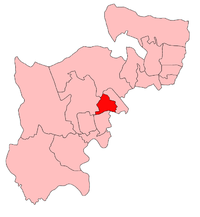
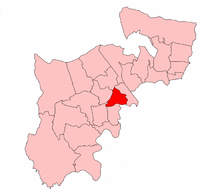
Willesden West was a borough constituency in the parliamentary county of Middlesex, adjoining the County of London and forming part of the London conurbation. It returned one Member of Parliament to the House of Commons of the Parliament of the United Kingdom.
History


Until 1918, Willesden formed part of the Harrow Division of Middlesex. The constituency was created by the Representation of the People Act 1918, and was first contested in the general election of that year. The boundaries were altered by further legislation in 1948 and the constituency was abolished when new seats based on the London Boroughs created by the London Government Act 1963 came into use for the February 1974 general election. The area of the constituency was divided between the two new seats of Brent East and Brent North.[1]
Boundaries
The 1918 legislation created a new parliamentary borough of Willesden, identical in area with the urban district of Willesden, and divided it into two single-member divisions. Willesden West comprised five of the eleven wards of the urban district: Church End, Harlesden, Roundwood, Stonebridge and Willesden Green. The remaining six wards formed the Willseden East division. In 1933 Willesden was incorporated as a municipal borough, although this made no change to the parliamentary divisions.[1]
When constituencies were redrawn prior to the 1950 general election, Willesden West was redefined in terms of seven wards of the borough as they then existed: Church End, Harlesden, Kensal Rise, Manor, Roundwood, Stonebridge and Willesden Green. Kensal Rise had previously formed part of Willesden East.[1]
Members of Parliament
| Election | Member | Party | |
|---|---|---|---|
| 1918 | Charles Pinkham | Coalition Conservative | |
| 1922 | George James Furness | Conservative | |
| 1923 | Samuel Philip Viant | Labour | |
| 1931 | Mavis Tate | Conservative | |
| 1935 | Samuel Viant | Labour | |
| 1959 | Laurie Pavitt | Labour Co-operative | |
| Feb 1974 | constituency abolished | ||
Elections
Elections in the 1910s
| General Election 1918: Willesden West[2] | |||||
|---|---|---|---|---|---|
| Party | Candidate | Votes | % | ±% | |
| Unionist | 10,503 | 54.1 | n/a | ||
| Labour | Samuel Phillip Viant | 7,217 | 37.2 | n/a | |
| Liberal | John Smyth Crone | 1,697 | 8.7 | n/a | |
| Majority | 3,286 | 16.9 | n/a | ||
| Turnout | 53.3 | n/a | |||
| Unionist win | |||||
- endorsed by the Coalition Government.
Elections in the 1920s
| General Election 1922: Willesden West[3] | |||||
|---|---|---|---|---|---|
| Party | Candidate | Votes | % | ±% | |
| Unionist | George James Furness | 13,328 | 51.5 | -2.6 | |
| Labour | Samuel Phillip Viant | 12,529 | 48.5 | ||
| Majority | 799 | 3.0 | |||
| Turnout | 66.7 | ||||
| Unionist hold | Swing | ||||
| General Election 1923: Willesden West[4] | |||||
|---|---|---|---|---|---|
| Party | Candidate | Votes | % | ±% | |
| Labour | Samuel Phillip Viant | 14,004 | 51.3 | ||
| Unionist | George James Furness | 8,256 | 30.3 | -18.2 | |
| Liberal | David Cleghorn Thomson | 5,030 | 18.4 | n/a | |
| Majority | 5,748 | 21.0 | |||
| Turnout | 69.1 | ||||
| Labour gain from Unionist | Swing | ||||
| General Election 1924: Willesden West[5] | |||||
|---|---|---|---|---|---|
| Party | Candidate | Votes | % | ±% | |
| Labour | Samuel Phillip Viant | 14,884 | 47.3 | ||
| Unionist | Mitford Brice | 13,539 | 43.0 | ||
| Liberal | James McCulloch | 3,061 | 9.7 | ||
| Majority | 1,345 | 4.3 | |||
| Turnout | 77.6 | ||||
| Labour hold | Swing | ||||
| General Election 1929: Willesden West[6] | |||||
|---|---|---|---|---|---|
| Party | Candidate | Votes | % | ±% | |
| Labour | Samuel Phillip Viant | 20,583 | 52.3 | ||
| Unionist | Malcolm Stewart McCorquodale | 12,779 | 32.4 | ||
| Liberal | Arthur Lewis Leighton | 6,038 | 15.3 | ||
| Majority | 7,804 | 19.9 | |||
| Turnout | 73.4 | ||||
| Labour hold | Swing | ||||
Elections in the 1930s
| General Election 1931: Willesden West[7] | |||||
|---|---|---|---|---|---|
| Party | Candidate | Votes | % | ±% | |
| Conservative | Mavis Constance Tate | 23,910 | 60.6 | +28.2 | |
| Labour | Samuel Phillip Viant | 15,550 | 39.4 | ||
| Majority | 8,360 | 21.2 | |||
| Turnout | 39,460 | 71.7 | |||
| Conservative gain from Labour | Swing | ||||
| General Election 1935: Willesden West[8] | |||||
|---|---|---|---|---|---|
| Party | Candidate | Votes | % | ±% | |
| Labour | Samuel Phillip Viant | 19,402 | 54.1 | ||
| Conservative | S Samuel | 16,472 | 45.9 | ||
| Majority | 2,930 | 8.2 | |||
| Turnout | 35,874 | 64.4 | |||
| Labour gain from Conservative | Swing | ||||
General Election 1939/40
Another General Election was required to take place before the end of 1940. The political parties had been making preparations for an election to take place and by the Autumn of 1939, the following candidates had been selected;
- Labour: Samuel Phillip Viant[9]
- Conservative:
Elections in the 1940s
| General Election 1945: Willesden West[10] | |||||
|---|---|---|---|---|---|
| Party | Candidate | Votes | % | ±% | |
| Labour | Samuel Phillip Viant | 26,566 | 72.2 | ||
| Conservative | JB Cartland | 10,236 | 27.8 | ||
| Majority | 16,330 | 44.4 | |||
| Turnout | 70.5 | ||||
| Labour hold | Swing | ||||
Elections in the 1950s
| General Election 1950: [11] | |||||
|---|---|---|---|---|---|
| Party | Candidate | Votes | % | ±% | |
| Labour | Samuel Phillip Viant | 33,963 | 61.1 | ||
| Conservative | Attracta Genevieve Rewcastle | 17,848 | 32.1 | ||
| Liberal | Sirdar Karan S.B. Ahluwalia | 2,853 | 5.1 | ||
| Communist | D. A. Michaelson | 938 | 1.7 | ||
| Majority | 16,115 | 29.0 | |||
| Turnout | 83.2 | ||||
| Labour hold | Swing | ||||
| General Election 1951: [12] | |||||
|---|---|---|---|---|---|
| Party | Candidate | Votes | % | ±% | |
| Labour | Samuel Phillip Viant | 35,296 | 64.3 | ||
| Conservative | John L Bott | 19,632 | 35.7 | ||
| Majority | 15,664 | 28.6 | |||
| Turnout | |||||
| Labour hold | Swing | ||||
| General Election 1955: [13] | |||||
|---|---|---|---|---|---|
| Party | Candidate | Votes | % | ±% | |
| Labour | Samuel Phillip Viant | 29,185 | 61.8 | -2.5 | |
| Conservative | Peter B Kenyon | 18,074 | 38.2 | +2.5 | |
| Majority | 11,111 | 23.6 | |||
| Turnout | 47,259 | 74.4 | |||
| Labour hold | Swing | -2.5 | |||
| General Election 1959: [14] | |||||
|---|---|---|---|---|---|
| Party | Candidate | Votes | % | ±% | |
| Labour | Laurence Anstice Pavitt | 25,680 | 57.2 | ||
| Conservative | Mrs. Pamela S Brookes | 17,946 | 39.9 | ||
| Communist | Leslie G Burt | 1,324 | 2.9 | ||
| Majority | 7,734 | 17.3 | |||
| Turnout | 44,950 | 73.0 | |||
| Labour hold | Swing | ||||
Elections in the 1960s
| General Election 1964: [15] | |||||
|---|---|---|---|---|---|
| Party | Candidate | Votes | % | ±% | |
| Labour | Laurence Anstice Pavitt | 23,862 | 62.8 | ||
| Conservative | John S Grose | 12,961 | 34.2 | ||
| Communist | Leslie G Burt | 1,130 | 3.0 | ||
| Majority | 10,901 | 28.6 | |||
| Turnout | 37,953 | 63.5 | |||
| Labour hold | Swing | ||||
| General Election 1966: [16] | |||||
|---|---|---|---|---|---|
| Party | Candidate | Votes | % | ±% | |
| Labour | Laurence Anstice Pavitt | 24,944 | 68.5 | +5.7 | |
| Conservative | Miss A Pamela Thomas | 10,362 | 28.4 | -5.7 | |
| Communist | Leslie G Burt | 1,140 | 3.1 | ||
| Majority | 14,582 | 40.1 | +11.4 | ||
| Turnout | 36,446 | 63.6 | +0.1 | ||
| Labour hold | Swing | +5.7 | |||
Elections in the 1970s
| General Election 1970: [17] | |||||
|---|---|---|---|---|---|
| Party | Candidate | Votes | % | ±% | |
| Labour | Laurence Anstice Pavitt | 21,918 | 67.2 | ||
| Conservative | Ronald F Dyason | 10,163 | 31.2 | ||
| Communist | Leslie G Burt | 515 | 1.6 | ||
| Majority | 11,755 | 36.0 | |||
| Turnout | 32,596 | 59.3 | |||
| Labour hold | Swing | +2.0 | |||
References
- ↑ 1.0 1.1 1.2 Youngs, Frederic A, Jr. (1979). Guide to the Local Administrative Units of England, Vol.I: Southern England. London: Royal Historical Society. pp. 745–748. ISBN 0-901050-67-9.
- ↑ British Parliamentary Election Results 1918-1949, FWS Craig
- ↑ British Parliamentary Election Results 1918-1949, FWS Craig
- ↑ British Parliamentary Election Results 1918-1949, FWS Craig
- ↑ British Parliamentary Election Results 1918-1949, FWS Craig
- ↑ British Parliamentary Election Results 1918-1949, FWS Craig
- ↑ British Parliamentary Election Results 1918-1949, FWS Craig
- ↑ British Parliamentary Election Results 1918-1949, FWS Craig
- ↑ Report of the Annual Conference of the Labour Party, 1939
- ↑ British Parliamentary Election Results 1918-1949, FWS Craig
- ↑ British parliamentary election results, 1950-1973 by FWS Craig
- ↑ British parliamentary election results, 1950-1973 by FWS Craig
- ↑ British parliamentary election results, 1950-1973 by FWS Craig
- ↑ F W S Craig, British Parliamentary Election Results 1950-1973; Political Reference Publications, Glasgow 1973
- ↑ F W S Craig, British Parliamentary Election Results 1950-1973; Political Reference Publications, Glasgow 1973
- ↑ British parliamentary election results, 1950-1973 by FWS Craig
- ↑ British parliamentary election results, 1950-1973 by FWS Craig