Wigan Metropolitan Borough Council election, 2011
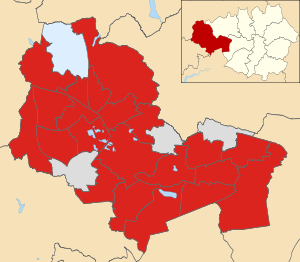
Map of the results of the 2011 Wigan council election.
Labour in red, independents in grey and Independent Conservative in pale blue.
Elections to Wigan Council were held in May 2011. One-third of the council was up for election. These elections were held as part of the United Kingdom local elections, 2011.[1][2][3]
Election result
| Wigan Local Election Result 2011 |
| Party |
Seats |
Gains |
Losses |
Net gain/loss |
Seats % |
Votes % |
Votes |
+/− |
| |
Labour |
21 |
6 |
0 |
+6 |
84.0 |
54.1 |
43,384 |
+8.6% |
| |
Independent |
3 |
1 |
1 |
0 |
12.0 |
12.5 |
10,046 |
+5.2% |
| |
Independent Conservative |
1 |
0 |
1 |
-1 |
4.0 |
3.5 |
2,809 |
+0.4% |
| |
Conservative |
0 |
0 |
2 |
-2 |
0.0 |
19.5 |
15,603 |
+0.8% |
| |
Community Action |
0 |
0 |
2 |
-2 |
0.0 |
4.8 |
3,836 |
-3.2% |
| |
Liberal Democrat |
0 |
0 |
1 |
-1 |
0.0 |
2.7 |
2,159 |
-6.2% |
| |
BNP |
0 |
0 |
0 |
0 |
0.0 |
1.0 |
777 |
-5.5% |
| |
UKIP |
0 |
0 |
0 |
0 |
0.0 |
0.6 |
498 |
-0.7% |
| |
TUSC |
0 |
0 |
0 |
0 |
0.0 |
0.4 |
320 |
+0.4% |
| |
England First |
0 |
0 |
0 |
0 |
0.0 |
0.1 |
114 |
+0.0% |
This result had the following consequences for the total number of seats on the Council after the elections:
| Party |
Previous council |
New council |
|
Labour |
52 |
58 |
|
Independent |
7 |
7 |
|
Conservative |
7 |
5 |
|
Community Action |
4 |
2 |
|
Liberal Democrat |
3 |
2 |
|
Wigan Independent Conservative |
2 |
1 |
|
BNP |
0 |
0 |
|
UKIP |
0 |
0 |
|
Trade Unionist & Socialist |
0 |
0 |
|
England First |
0 |
0 |
| Total |
75 |
75 |
| Working majority |
29 |
41 |
Ward results
Abram
| Abram[2][3] |
| Party |
Candidate |
Votes |
% |
±% |
|
Labour |
Eunice Smethurst |
1,696 |
56.6 |
+3.8 |
|
Independent |
Sandra Atherton |
774 |
25.8 |
+9.3 |
|
Conservative |
Marion Green |
271 |
9.0 |
-3.3 |
|
BNP |
Dennis Shambley |
242 |
8.1 |
-4.1 |
| Rejected ballots |
16 |
0.5 |
+0.2 |
| Majority |
922 |
30.7 |
-5.4 |
| Turnout |
2,999 |
28.2 |
-23.6 |
|
Labour hold |
Swing |
-2.7 |
|
Ashton
| Ashton[2][3] |
| Party |
Candidate |
Votes |
% |
±% |
|
Labour |
Joel Haddley |
1,595 |
48.5 |
+9.7 |
|
Independent |
Walter Carney |
710 |
21.6 |
+11.5 |
|
Community Action |
Leanne Brotherton |
626 |
19.0 |
-15.7 |
|
Conservative |
Marie Winstanley |
344 |
10.4 |
+0.4 |
| Rejected ballots |
17 |
0.5 |
+0.2 |
| Majority |
885 |
26.9 |
+22.9 |
| Turnout |
3,292 |
36.0 |
-27.1 |
|
Labour gain from Independent |
Swing |
-0.9 |
|
Aspull, New Springs, Whelley
| Aspull, New Springs, Whelley[2][3] |
| Party |
Candidate |
Votes |
% |
±% |
|
Labour |
Christopher Ready |
2,509 |
65.7 |
+16.1 |
|
Liberal Democrat |
Alan Robinson |
796 |
20.8 |
-2.4 |
|
Conservative |
Jane Surples |
482 |
12.6 |
-6.0 |
| Rejected ballots |
34 |
0.9 |
+0.6 |
| Majority |
1,713 |
44.8 |
+18.5 |
| Turnout |
3,821 |
37.5 |
-26.6 |
|
Labour hold |
Swing |
+9.2 |
|
Astley Mosley Common
| Astley Mosley Common[2][3] |
| Party |
Candidate |
Votes |
% |
±% |
|
Labour |
Brendan Bowen |
2,028 |
62.7 |
+23.1 |
|
Conservative |
Nasri Barghothi |
1,158 |
35.8 |
+8.1 |
| Rejected ballots |
50 |
1.5 |
+0.8 |
| Majority |
870 |
26.9 |
+19.4 |
| Turnout |
3,236 |
34.4 |
-28.7 |
|
Labour hold |
Swing |
+7.5 |
|
Atherleigh
| Atherleigh[2][3] |
| Party |
Candidate |
Votes |
% |
±% |
|
Labour |
Mark Aldred |
1,499 |
58.9 |
+15.6 |
|
Independent |
Jamie Hodgkinson |
537 |
21.1 |
+11.6 |
|
Conservative |
Derek Davies |
491 |
19.3 |
+0.8 |
| Rejected ballots |
18 |
0.7 |
+0.7 |
| Majority |
962 |
37.8 |
+13.0 |
| Turnout |
2,545 |
29.6 |
-26.4 |
|
Labour hold |
Swing |
+2.0 |
|
Atherton
| Atherton[2][3] |
| Party |
Candidate |
Votes |
% |
±% |
|
Independent |
Norman Bradbury |
1,517 |
42.6 |
+28.6 |
|
Labour |
David Welch |
1,271 |
35.7 |
-9.5 |
|
Conservative |
Vivienne Lee |
437 |
12.3 |
-3.5 |
|
TUSC |
Stephen Hall |
320 |
9.0 |
+9.0 |
| Rejected ballots |
17 |
0.5 |
+0.0 |
| Majority |
246 |
6.9 |
-22.5 |
| Turnout |
3,562 |
32.3 |
-24.7 |
|
Independent hold |
Swing |
+19.0 |
|
Bryn
| Bryn[2][3] |
| Party |
Candidate |
Votes |
% |
±% |
|
Independent |
Gary Wilkes |
1,955 |
54.2 |
+24.2 |
|
Labour |
John Allen |
1,363 |
37.8 |
-2.4 |
|
Conservative |
Stuart Foy |
274 |
7.6 |
-1.7 |
| Rejected ballots |
17 |
0.5 |
+0.0 |
| Majority |
592 |
16.4 |
+6.2 |
| Turnout |
3,609 |
39.0 |
-23.4 |
|
Independent hold |
Swing |
+13.3 |
|
Douglas
| Douglas[2][3] |
| Party |
Candidate |
Votes |
% |
±% |
|
Labour |
Michael Dewhurst |
1,867 |
71.9 |
+13.2 |
|
Independent |
Anthony Unsworth |
393 |
15.1 |
+7.0 |
|
Conservative |
Margaret Atherton |
321 |
12.4 |
-1.7 |
| Rejected ballots |
16 |
0.6 |
-0.1 |
| Majority |
1,474 |
56.8 |
+12.2 |
| Turnout |
2,597 |
26.5 |
-22.5 |
|
Labour hold |
Swing |
+3.1 |
|
Golborne Lowton West
Hindley
| Hindley[2][3] |
| Party |
Candidate |
Votes |
% |
±% |
|
Labour |
James Churton |
1,831 |
59.2 |
+9.9 |
|
Independent |
David Culshaw |
1,000 |
32.3 |
+6.4 |
|
Conservative |
Stephen Holt |
251 |
8.1 |
-3.6 |
| Rejected ballots |
12 |
0.4 |
-0.2 |
| Majority |
831 |
26.9 |
+3.5 |
| Turnout |
3,094 |
30.7 |
-22.0 |
|
Labour hold |
Swing |
+1.7 |
|
Hindley Green
| Hindley Green[2][3] |
| Party |
Candidate |
Votes |
% |
±% |
|
Independent |
Francis Carmichael |
1,185 |
39.7 |
+11.7 |
|
Labour |
Romana Kowalczuk |
927 |
31.1 |
-0.4 |
|
Community Action |
Barry Fagan |
626 |
21.0 |
+0.3 |
|
Conservative |
Margaret Winstanley |
232 |
7.8 |
-3.5 |
| Rejected ballots |
14 |
0.5 |
-0.1 |
| Majority |
258 |
8.6 |
+5.1 |
| Turnout |
2,984 |
34.6 |
-27.1 |
|
Independent gain from Community Action |
Swing |
+6.0 |
|
Ince
| Ince[2][3] |
| Party |
Candidate |
Votes |
% |
±% |
|
Labour |
Janice Sharratt |
1,679 |
66.5 |
+5.6 |
|
BNP |
Anthony Farrell |
296 |
11.7 |
-1.8 |
|
Independent |
Brian Kenrick |
243 |
9.6 |
+4.3 |
|
Conservative |
Raymond Whittingham |
177 |
7.0 |
-2.5 |
|
England First |
Robert Hague |
114 |
4.5 |
+1.3 |
| Rejected ballots |
17 |
0.7 |
+0.2 |
| Majority |
1,383 |
54.8 |
+7.5 |
| Turnout |
2,526 |
28.2 |
-20.1 |
|
Labour hold |
Swing |
+3.7 |
|
Leigh East
| Leigh East[2][3] |
| Party |
Candidate |
Votes |
% |
±% |
|
Labour |
Anita Thorpe |
1,835 |
69.0 |
+20.9 |
|
Conservative |
Richard Short |
785 |
29.5 |
+6.0 |
| Rejected ballots |
38 |
1.4 |
+0.4 |
| Majority |
1,050 |
39.5 |
+18.6 |
| Turnout |
2,658 |
28.5 |
-27.3 |
|
Labour hold |
Swing |
+7.4 |
|
Leigh South
Leigh West
| Leigh West[2][3] |
| Party |
Candidate |
Votes |
% |
±% |
|
Labour |
Myra Whiteside |
1,844 |
64.2 |
+17.7 |
|
Independent |
Brian Turrell |
430 |
15.0 |
+5.1 |
|
Conservative |
John Oxley |
334 |
11.6 |
+1.3 |
|
BNP |
Martin Grainey |
239 |
8.3 |
-4.5 |
| Rejected ballots |
24 |
0.8 |
+0.3 |
| Majority |
1,414 |
49.3 |
+18.1 |
| Turnout |
2,871 |
26.3 |
-25.0 |
|
Labour hold |
Swing |
+6.3 |
|
Lowton East
Orrell
Pemberton
Shevington with Lower Ground
Standish with Langtree
Tyldesley
| Tyldesley[2][3] |
| Party |
Candidate |
Votes |
% |
±% |
|
Labour |
Stephen Hellier |
1,529 |
46.8 |
+14.7 |
|
Liberal Democrat |
Keith McManus |
1,363 |
41.7 |
+2.1 |
|
Conservative |
David Ollerton |
357 |
10.9 |
-5.0 |
| Rejected ballots |
21 |
0.6 |
+0.4 |
| Majority |
166 |
5.1 |
-2.4 |
| Turnout |
3,270 |
31.9 |
-26.4 |
|
Labour gain from Liberal Democrat |
Swing |
+6.3 |
|
Wigan Central
Wigan West
| Wigan West[2][3] |
| Party |
Candidate |
Votes |
% |
±% |
|
Labour |
Stephen Dawber |
2,301 |
74.6 |
+13.1 |
|
Conservative |
Barry Alder |
739 |
23.7 |
+6.3 |
| Rejected ballots |
54 |
1.8 |
+0.9 |
| Majority |
1,571 |
50.9 |
+6.8 |
| Turnout |
3,085 |
30.7 |
-26.7 |
|
Labour hold |
Swing |
+3.4 |
|
Winstanley
| Winstanley[2][3] |
| Party |
Candidate |
Votes |
% |
±% |
|
Labour |
Rona Winkworth |
1,509 |
47.9 |
+4.5 |
|
Independent |
Christine Shore |
1,066 |
33.8 |
+11.3 |
|
Conservative |
Michael Nicholls |
552 |
17.5 |
+2.5 |
| Rejected ballots |
24 |
0.8 |
+0.5 |
| Majority |
443 |
14.1 |
-6.8 |
| Turnout |
3,151 |
35.5 |
-29.3 |
|
Labour hold |
Swing |
-3.4 |
|
Worsley Mesnes
References
|
|---|
| | Metropolitan boroughs |
- Barnsley
- Birmingham
- Bolton
- Bradford
- Bury
- Calderdale
- Coventry
- Doncaster
- Dudley
- Gateshead
- Kirklees
- Knowsley
- Leeds
- Liverpool
- Manchester
- Newcastle upon Tyne
- North Tyneside
- Oldham
- Rochdale
- Rotherham
- Salford
- Sandwell
- Sefton
- Sheffield
- Solihull
- South Tyneside
- St Helens
- Stockport
- Sunderland
- Tameside
- Trafford
- Wakefield
- Walsall
- Wigan
- Wirral
- Wolverhampton
|
|---|
| | Unitary authorities | |
|---|
| | District councils (England) | |
|---|
| | District councils (Northern Ireland) |
- Antrim
- Ards
- Armagh
- Ballymena
- Ballymoney
- Banbridge
- Belfast
- Carrickfergus
- Castlereagh
- Coleraine
- Cookstown
- Craigavon
- Derry
- Down
- Dungannon and South Tyrone
- Fermanagh
- Larne
- Limavady
- Lisburn
- Magherafelt
- Moyle
- Newry and Mourne
- Newtownabbey
- North Down
- Omagh
- Strabane
|
|---|
| | Mayoral elections | |
|---|
| | National Assembly elections | |
|---|
| | Referendums | |
|---|
|