Wigan Metropolitan Borough Council election, 1994
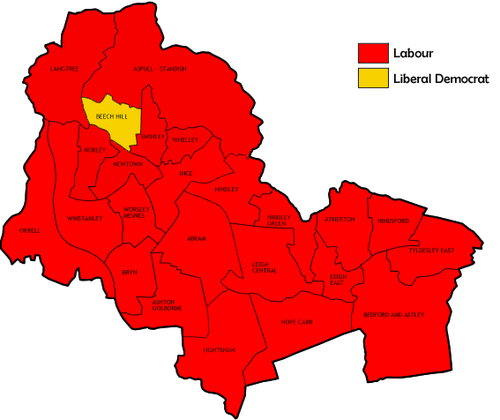
Map of the results of the 1994 Wigan council election.
Elections to the Wigan council were held on Thursday, 5 May 1994, with one third of the seats up for election. Prior to the election, Labour had defended their seats in two by-elections for Abram and Hindley. The election suffered from a mixture of a poor contesting rate and low voter turnout. The number of candidates contesting was just 50, the lowest since 1975, with four wards going unopposed, and Lib Dems back to fighting a half of the seats, and the Conservatives less than two-thirds. The only other opposition standing were three Independent Labour candidates, one of which was the previous - but since deselected - Labour incumbent for the seat being fought in Worsley Mesnes. Voter turnout rose from the previous election's nadir, but at 30.4%, still well below average.
Labour achieved their highest vote share to date, with an overwhelming 70.3% of votes cast. Conversely the Conservatives obtained both their lowest vote share, and lowest vote figure, on record. The Lib Dems, whilst suffering a drop to 16% - a figure below average for results in recent years - witnessed nothing as dramatic. Party seat totals remained unchanged, with Labour and the Lib Dems gaining a seat from each other. The Lib Dem narrowly gained (by just four votes) their third in Beech Hill, turning a ward entirely represented by Labour from the early to mid eighties, into solely Lib Dem for the first time. Labour elsewhere regained a seat in Hope Carr, returning that to entirely Labour.[1]
Election result
| Wigan Local Election Result 1994 |
| Party |
Seats |
Gains |
Losses |
Net gain/loss |
Seats % |
Votes % |
Votes |
+/− |
| |
Labour |
23 |
1 |
1 |
0 |
95.8 |
70.3 |
41,704 |
+14.6% |
| |
Liberal Democrat |
1 |
1 |
1 |
0 |
4.2 |
16.0 |
9,520 |
-4.1% |
| |
Conservative |
0 |
0 |
0 |
0 |
0.0 |
11.3 |
6,729 |
-10.2% |
| |
Independent Labour |
0 |
0 |
0 |
0 |
0.0 |
2.3 |
1,343 |
+1.4% |
This result had the following consequences for the total number of seats on the Council after the elections:
| Party |
Previous council |
New council |
|
Labour |
61 |
61 |
|
Liberal Democrats |
8 |
8 |
|
Conservatives |
2 |
2 |
|
Independent Labour |
1 |
1 |
| Total |
72 |
72 |
| Working majority |
50 |
50 |
Ward results
| Atherton[1] |
| Party |
Candidate |
Votes |
% |
±% |
|
Labour |
S. Loundon |
2,033 |
84.6 |
+8.2 |
|
Independent Labour |
D. Graeme |
370 |
15.4 |
-8.2 |
| Majority |
1,663 |
69.2 |
+16.3 |
| Turnout |
2,403 |
26.1 |
+3.9 |
|
Labour hold |
Swing |
+8.2 |
|
| Bedford-Astley[1] |
| Party |
Candidate |
Votes |
% |
±% |
|
Labour |
F. Walker |
1,717 |
68.8 |
+18.3 |
|
Liberal Democrat |
G. Mann |
780 |
31.2 |
+5.0 |
| Majority |
937 |
37.5 |
+13.3 |
| Turnout |
2,497 |
28.7 |
+2.5 |
|
Labour hold |
Swing |
+6.6 |
|
| Beech Hill[1] |
| Party |
Candidate |
Votes |
% |
±% |
|
Liberal Democrat |
L. Brooks |
1,621 |
48.0 |
-15.1 |
|
Labour |
T. Bishop |
1,617 |
47.9 |
+15.5 |
|
Conservative |
J. Cartwright |
138 |
4.1 |
-0.3 |
| Majority |
4 |
0.1 |
-30.7 |
| Turnout |
3,376 |
37.4 |
+4.1 |
|
Liberal Democrat gain from Labour |
Swing |
-15.3 |
|
| Hindley[1] |
| Party |
Candidate |
Votes |
% |
±% |
|
Labour |
W. Shaw |
1,946 |
81.8 |
+3.7 |
|
Liberal Democrat |
F. Graham |
434 |
18.2 |
-3.7 |
| Majority |
1,512 |
63.5 |
+7.4 |
| Turnout |
2,380 |
24.8 |
+6.2 |
|
Labour hold |
Swing |
+3.7 |
|
| Hope Carr[1] |
| Party |
Candidate |
Votes |
% |
±% |
|
Labour |
K. Anderson |
1,812 |
50.4 |
+12.6 |
|
Liberal Democrat |
P. Hough |
1,254 |
34.9 |
+3.8 |
|
Conservative |
D. Morris |
526 |
14.6 |
-16.4 |
| Majority |
558 |
15.5 |
+8.8 |
| Turnout |
3,592 |
35.6 |
+4.9 |
|
Labour gain from Liberal Democrat |
Swing |
+4.4 |
|
| Langtree[1] |
| Party |
Candidate |
Votes |
% |
±% |
|
Labour |
J. O'Neill |
2,250 |
57.2 |
+21.1 |
|
Liberal Democrat |
J. Shaw |
1,083 |
27.5 |
-18.3 |
|
Conservative |
F. Parkinson |
381 |
9.7 |
+9.7 |
|
Independent Labour |
H. O'Neill |
218 |
5.5 |
+5.5 |
| Majority |
1,167 |
29.7 |
+19.9 |
| Turnout |
3,932 |
34.7 |
+3.4 |
|
Labour hold |
Swing |
+19.7 |
|
| Leigh East[1] |
| Party |
Candidate |
Votes |
% |
±% |
|
Labour |
T. Harper |
1,870 |
68.6 |
+12.7 |
|
Liberal Democrat |
S. Hide |
856 |
31.4 |
-12.7 |
| Majority |
1,014 |
37.2 |
+25.3 |
| Turnout |
2,726 |
27.1 |
+6.8 |
|
Labour hold |
Swing |
+12.7 |
|
| Newtown[1] |
| Party |
Candidate |
Votes |
% |
±% |
|
Labour |
K. Pye |
1,964 |
85.1 |
+12.9 |
|
Liberal Democrat |
H. Wagner |
183 |
7.9 |
-5.5 |
|
Conservative |
G. Peach |
160 |
6.9 |
-7.4 |
| Majority |
1,781 |
77.2 |
+19.3 |
| Turnout |
2,307 |
25.8 |
+9.3 |
|
Labour hold |
Swing |
+9.2 |
|
| Norley[1] |
| Party |
Candidate |
Votes |
% |
±% |
|
Labour |
N. Tuner |
1,973 |
85.2 |
+7.3 |
|
Liberal Democrat |
B. Turner |
343 |
14.8 |
+1.7 |
| Majority |
1,630 |
70.4 |
+5.7 |
| Turnout |
2,316 |
30.4 |
+9.7 |
|
Labour hold |
Swing |
+2.8 |
|
| Winstanley[1] |
| Party |
Candidate |
Votes |
% |
±% |
|
Labour |
W. Evans |
2,168 |
64.3 |
+11.5 |
|
Liberal Democrat |
P. Evans |
721 |
21.4 |
-0.5 |
|
Conservative |
M. Green |
483 |
14.3 |
-11.1 |
| Majority |
1,447 |
42.9 |
+15.5 |
| Turnout |
3,372 |
28.6 |
+7.7 |
|
Labour hold |
Swing |
+6.0 |
|
| Worsley Mesnes[1] |
| Party |
Candidate |
Votes |
% |
±% |
|
Labour |
W. Rotherham |
1,774 |
59.8 |
-5.3 |
|
Independent Labour |
H. Milligan |
755 |
25.5 |
+25.5 |
|
Liberal Democrat |
W. Sly |
272 |
9.2 |
-9.1 |
|
Conservative |
T. Sutton |
163 |
5.5 |
-11.0 |
| Majority |
1,019 |
34.4 |
-12.5 |
| Turnout |
2,964 |
29.8 |
+12.5 |
|
Labour hold |
Swing |
-15.4 |
|
References